This arrow loop diagram sample was created on the base of the figure illustrating the article "Up Close and Personal. Life as an Intelligence Analyst" from the FBI website. [fbi.gov/ news/ stories/ 2006/ may/ arias050506]
"The traditional Intelligence cycle is the fundamental cycle of intelligence processing in a civilian or military intelligence agency or in law enforcement as a closed path consisting of repeating nodes. The stages of the intelligence cycle include the issuance of requirements by decision makers, collection, processing, analysis, and publication of intelligence. The circuit is completed when decision makers provide feedback and revised requirements. The intelligence cycle is also called the Intelligence Process by the U.S. Department of Defense (DoD) and the uniformed services." [Intelligence cycle. Wikipedia]
The arrow loop diagram example "Intelligence analyst cycle" was created using the ConceptDraw PRO diagramming and vector drawing software extended with the Target and Circular Diagrams solution from the Marketing area of ConceptDraw Solution Park.
www.conceptdraw.com/ solution-park/ marketing-target-and-circular-diagrams
Arrow loop diagram
 Target and Circular Diagrams
This solution extends ConceptDraw DIAGRAM software with samples, templates and library of design elements for drawing the Target and Circular Diagrams.
Process Flowchart


 Education Package
Education Package is a comprehensive set of multifarious graphical solutions from ConceptDraw Solution Park, collected together in help to ConceptDraw DIAGRAM users working in a field of science, education and training, which is aimed at improving the quality of education and helping to design with ease variety of interesting and colorful educational materials, diagrams, charts and maps. Use it to present the information and knowledge in an interesting, clear, structured and simple form to achieve a success in education and pedagogy, to maintain the interest of students and pupils throughout the whole learning process, at the lectures, lessons and even during independent work with additional materials, to contribute to better perception of scientific information by listeners during the conferences and reports.
 Flowcharts
The Flowcharts solution for ConceptDraw DIAGRAM is a comprehensive set of examples and samples in several varied color themes for professionals that need to represent graphically a process. Solution value is added by the basic flow chart template and shapes' libraries of flowchart notation. ConceptDraw DIAGRAM flow chart creator lets one depict the processes of any complexity and length, as well as design the Flowchart either vertically or horizontally.
Biology Symbols

Biology solution provides 3 libraries with large quantity of vector biology symbols: Biochemistry of Metabolism Library, Carbohydrate Metabolism Library, Citric Acid Cycle (TCA Cycle) Library.
Beauty in nature Illustrations and Clipart

 Business Process Diagrams
Business Process Diagrams solution extends the ConceptDraw DIAGRAM BPM software with RapidDraw interface, templates, samples and numerous libraries based on the BPMN 1.2 and BPMN 2.0 standards, which give you the possibility to visualize equally easy simple and complex processes, to design business models, to quickly develop and document in details any business processes on the stages of project’s planning and implementation.
Sales Dashboards for Your Company

 Business Diagrams
The Business Diagrams Solution extends ConceptDraw DIAGRAM with an extensive collection of professionally designed illustrative samples and a wide variety of vector stencils libraries, which are the real help for all business-related people, business analysts, business managers, business advisers, marketing experts, PR managers, knowledge workers, scientists, and other stakeholders allowing them to design the bright, neat, expressive and attractive Bubble Diagrams, Circle-Spoke Diagrams, Circular Arrows Diagrams, and Venn Diagrams with different quantity of sets in just minutes; and then successfully use them in documents, reports, statistical summaries, and presentations of any style.
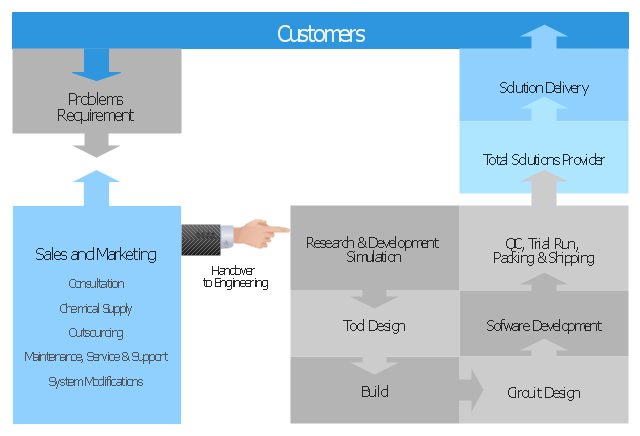
"Problem-solving consists of using generic or ad hoc methods, in an orderly manner, for finding solutions to problems. Some of the problem-solving techniques developed and used in artificial intelligence, computer science, engineering, mathematics, medicine, etc. are related to mental problem-solving techniques studied in psychology." [Problem solving. Wikipedia]
The block diagram example "Total solution process" was created using the ConceptDraw PRO diagramming and vector drawing software extended with the Block Diagrams solution from the area "What is a Diagram" of ConceptDraw Solution Park.
The block diagram example "Total solution process" was created using the ConceptDraw PRO diagramming and vector drawing software extended with the Block Diagrams solution from the area "What is a Diagram" of ConceptDraw Solution Park.
Block diagram
 Business Process Workflow Diagrams
The Business Process Workflow Diagrams solution enhances the ConceptDraw DIAGRAM functionality with predesigned examples, samples and a numerous collection of predesigned vector objects of workflow chart elements, icons, arrows, connectors, and varied wor
Example Process Flow

This circular arrows diagram sample shows advanced persistent threat lifecycle.
It was designed on the base of the Wikimedia Commons file: Advanced persistent threat lifecycle.jpg.
[commons.wikimedia.org/ wiki/ File:Advanced_ persistent_ threat_ lifecycle.jpg]
This file is licensed under the Creative Commons Attribution-Share Alike 3.0 Unported license. [creativecommons.org/ licenses/ by-sa/ 3.0/ deed.en]
"Advanced Persistent Threat (APT) APT is a set of stealthy and continuous hacking processes often orchestrated by human targeting a specific entity. APT usually targets organizations and or nations for business or political motives. APT processes require high degree of covertness over a long period of time. As the name implies, APT consists of three major components/ processes: advanced, persistent, and threat. The advanced process signifies sophisticated techniques using malware to exploit vulnerabilities in systems. The persistent process suggests that an external command and control is continuously monitoring and extracting data off a specific target. The threat process indicates human involvement in orchestrating the attack.
APT usually refers to a group, such as a government, with both the capability and the intent to persistently and effectively target a specific entity. The term is commonly used to refer to cyber threats, in particular that of Internet-enabled espionage using a variety of intelligence gathering techniques to access sensitive information, but applies equally to other threats such as that of traditional espionage or attack. Other recognized attack vectors include infected media, supply chain compromise, and social engineering. Individuals, such as an individual hacker, are not usually referred to as an APT as they rarely have the resources to be both advanced and persistent even if they are intent on gaining access to, or attacking, a specific target." [Advanced persistent threat. Wikipedia]
The arrow donut chart example
"Advanced persistent threat lifecycle" was created using the ConceptDraw PRO diagramming and vector drawing software extended with the Circular Arrows Diagrams solution from the area "What is a Diagram" of ConceptDraw Solution Park.
Circular arrows diagram

Flowchart Definition

Best Program to Make Workflow Diagrams

How to Design a Good Workflow

How To Create a FlowChart using ConceptDraw

Sales Process Flowchart. Flowchart Examples

Business Graphics Software
- Intelligence analyst cycle - Arrow loop diagram | Target and Circular ...
- Product life cycle process - Flowchart | Intelligence analyst cycle ...
- Intelligence analyst cycle - Arrow loop diagram | Business ...
- Intelligence analyst cycle - Arrow loop diagram | The Circular Flow ...
- Business Intelligence Dashboard | Intelligence analyst cycle - Arrow ...
- Product life cycle process - Flowchart | Circular Arrows Diagrams ...
- Water cycle diagram | Circular arrows diagram - PDCA cycle ...
- Block Diagrams | Business Intelligence Dashboard | SYSML ...
- Divided Bar Diagrams | Basic Circle-Spoke Diagrams | Stakeholder ...
- Business feedback loop
- Business feedback loop | Innovation life cycle - Arrow loop diagram ...
- Innovation life cycle - Arrow loop diagram | National Preparedness ...
- Process Flowchart | Block Diagrams | Concept Maps | Psychology ...
- Process Flowchart | Business Intelligence Dashboard | Flowchart ...
- Block diagram - Total solution process | Process Flowchart | Root ...
- Flow Chart Diagram Of Intelligence Test
- Process Flowchart | Block diagram - Total solution process | Social ...
- Process Flowchart | Schematics Illustration Of Social Intelligence
- Basic Flowchart Symbols and Meaning | Business feedback loop ...
- Block diagram - Total solution process | Total Quality Management ...