This arrow loop diagram sample was created on the base of the figure illustrating the article "Up Close and Personal. Life as an Intelligence Analyst" from the FBI website. [fbi.gov/ news/ stories/ 2006/ may/ arias050506]
"The traditional Intelligence cycle is the fundamental cycle of intelligence processing in a civilian or military intelligence agency or in law enforcement as a closed path consisting of repeating nodes. The stages of the intelligence cycle include the issuance of requirements by decision makers, collection, processing, analysis, and publication of intelligence. The circuit is completed when decision makers provide feedback and revised requirements. The intelligence cycle is also called the Intelligence Process by the U.S. Department of Defense (DoD) and the uniformed services." [Intelligence cycle. Wikipedia]
The arrow loop diagram example "Intelligence analyst cycle" was created using the ConceptDraw PRO diagramming and vector drawing software extended with the Target and Circular Diagrams solution from the Marketing area of ConceptDraw Solution Park.
www.conceptdraw.com/ solution-park/ marketing-target-and-circular-diagrams
Arrow loop diagram
The Circular Flow Diagram

Business Intelligence Dashboard Software

 Target and Circular Diagrams
This solution extends ConceptDraw PRO software with samples, templates and library of design elements for drawing the Target and Circular Diagrams.
The vector stencils library "AWS On-Demand Workforce" contains 5 Amazon Web Services on-demand workforce icons: Amazon Mechanical Turk, Human Intelligence Tasks (HIT), Assignment/ Task, Workers, Requester.
Use it to draw Amazon Web Services architecture diagrams with ConceptDraw PRO diagramming and vector drawing software.
"Amazon Mechanical Turk (MTurk) is a crowdsourcing Internet marketplace enabling individuals and businesses (known as Requesters) to coordinate the use of human intelligence to perform tasks that computers are currently unable to do. It is one of the sites of Amazon Web Services. Employers are able to post jobs known as Human Intelligence Tasks (HITs), such as choosing the best among several photographs of a storefront, writing product descriptions, or identifying performers on music CDs. Workers (called Providers in Mechanical Turk's Terms of Service, or, more colloquially, Turkers) can then browse among existing jobs and complete them in exchange for a monetary payment set by the employer. To place jobs, the requesting programs use an open application programming interface (API), or the more limited MTurk Requester site." [Amazon Mechanical Turk. Wikipedia]
The AWS icons example "Design elements - AWS On-Demand Workforce" is included in the AWS Architecture Diagrams solution from the Computer and Networks area of ConceptDraw Solution Park.
Amazon Web Services icons
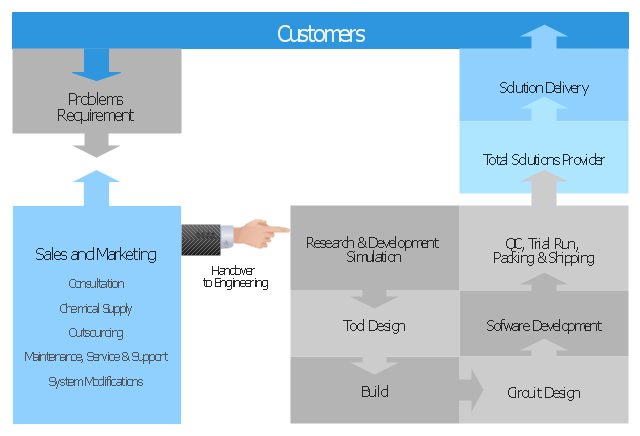
"Problem-solving consists of using generic or ad hoc methods, in an orderly manner, for finding solutions to problems. Some of the problem-solving techniques developed and used in artificial intelligence, computer science, engineering, mathematics, medicine, etc. are related to mental problem-solving techniques studied in psychology." [Problem solving. Wikipedia]
The block diagram example "Total solution process" was created using the ConceptDraw PRO diagramming and vector drawing software extended with the Block Diagrams solution from the area "What is a Diagram" of ConceptDraw Solution Park.
The block diagram example "Total solution process" was created using the ConceptDraw PRO diagramming and vector drawing software extended with the Block Diagrams solution from the area "What is a Diagram" of ConceptDraw Solution Park.
Block diagram
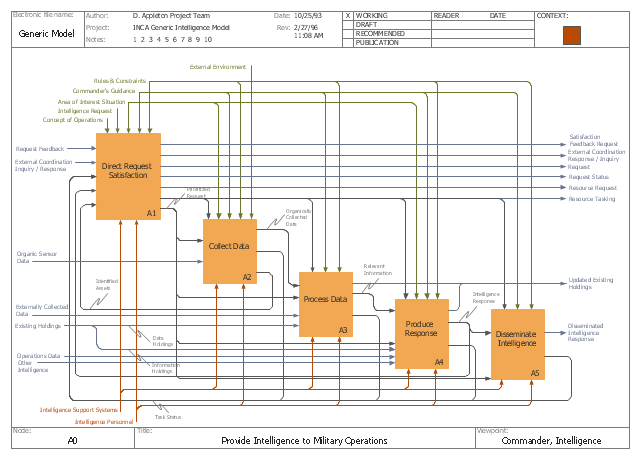
This IDEF0 diagram example was redesigned from the Wikimedia Commons file: C4ISR Architecture Framework, Example Activity Diagram in IDEF0 Format.jpg. [commons.wikimedia.org/ wiki/ File:C4ISR_ Architecture_ Framework,_ Example_ Activity_ Diagram_ in_ IDEF0_ Format.jpg]
"... the C4ISR concept of Command, Control, Communications, Computers, Intelligence, Surveillance and Reconnaissance ..." [en.wikipedia.org/ wiki/ C4ISR]
"The C4ISR Architectural Framework (C4ISR AF) is now known as DoDAF, is a reference model developed by the US Department of Defense in the 1990s." [commons.wikimedia.org/ wiki/ Category:C4ISR_ Architecture_ Framework]
"The Department of Defense Architecture Framework (DoDAF) is an architecture framework for the United States Department of Defense (DoD) that provides visualization infrastructure for specific stakeholders concerns through viewpoints organized by various views. These views are artifacts for visualizing, understanding, and assimilating the broad scope and complexities of an architecture description through tabular, structural, behavioral, ontological, pictorial, temporal, graphical, probabilistic, or alternative conceptual means.
This Architecture Framework is especially suited to large systems with complex integration and interoperability challenges, and it is apparently unique in its employment of "operational views". These views offer overview and details aimed to specific stakeholders within their domain and in interaction with other domains in which the system will operate." [en.wikipedia.org/ wiki/ Department_ of_ Defense_ Architecture_ Framework]
The example "C4ISR architecture framework - IDEF0 activity diagram" was created using the ConceptDraw PRO diagramming and vector drawing software extended with the solution "IDEF Business Process Diagrams" from the area "Business Processes" of ConceptDraw Solution Park.
IDEF0 business process diagram
Used Solutions
Stakeholder Management System

Cisco LAN. Cisco icons, shapes, stencils and symbols
")
"A root cause is an initiating cause of a causal chain which leads to an outcome or effect of interest. Commonly, root cause is used to describe the depth in the causal chain where an intervention could reasonably be implemented to change performance and prevent an undesirable outcome." [Root cause. Wikipedia]
"Problem-solving consists of using generic or ad hoc methods, in an orderly manner, for finding solutions to problems. Some of the problem-solving techniques developed and used in artificial intelligence, computer science, engineering, mathematics, medicine, etc. are related to mental problem-solving techniques studied in psychology." [Problem solving. Wikipedia]
This root cause analysis (RCA) tree diagram example "Personal problem solution" was created using the ConceptDraw PRO diagramming and vector drawing software extended with the Seven Management and Planning Tools solution from the Management area of ConceptDraw Solution Park.
Tree diagram

Process Flowchart


Sales Dashboard - Access Anywhere
This circular arrows diagram sample shows advanced persistent threat lifecycle.
It was designed on the base of the Wikimedia Commons file: Advanced persistent threat lifecycle.jpg.
[commons.wikimedia.org/ wiki/ File:Advanced_ persistent_ threat_ lifecycle.jpg]
This file is licensed under the Creative Commons Attribution-Share Alike 3.0 Unported license. [creativecommons.org/ licenses/ by-sa/ 3.0/ deed.en]
"Advanced Persistent Threat (APT) APT is a set of stealthy and continuous hacking processes often orchestrated by human targeting a specific entity. APT usually targets organizations and or nations for business or political motives. APT processes require high degree of covertness over a long period of time. As the name implies, APT consists of three major components/ processes: advanced, persistent, and threat. The advanced process signifies sophisticated techniques using malware to exploit vulnerabilities in systems. The persistent process suggests that an external command and control is continuously monitoring and extracting data off a specific target. The threat process indicates human involvement in orchestrating the attack.
APT usually refers to a group, such as a government, with both the capability and the intent to persistently and effectively target a specific entity. The term is commonly used to refer to cyber threats, in particular that of Internet-enabled espionage using a variety of intelligence gathering techniques to access sensitive information, but applies equally to other threats such as that of traditional espionage or attack. Other recognized attack vectors include infected media, supply chain compromise, and social engineering. Individuals, such as an individual hacker, are not usually referred to as an APT as they rarely have the resources to be both advanced and persistent even if they are intent on gaining access to, or attacking, a specific target." [Advanced persistent threat. Wikipedia]
The arrow donut chart example
"Advanced persistent threat lifecycle" was created using the ConceptDraw PRO diagramming and vector drawing software extended with the Circular Arrows Diagrams solution from the area "What is a Diagram" of ConceptDraw Solution Park.
Circular arrows diagram

Sport pictograms. Olympic Games

FSM — Finite-state Machine

- 4 Level pyramid model diagram - Information systems types ...
- Social Intelligence Schematic Diagram
- Intelligence analyst cycle - Arrow loop diagram | The Circular Flow ...
- Intelligence analyst cycle - Arrow loop diagram | Process Flowchart ...
- Stakeholder Onion Diagrams | Rapid UML | Intelligence analyst ...
- Diagrams Of The Schematic Illustration Of Social Intelligence
- Social Intelligence Schematics Diagram
- Intelligence analyst cycle - Arrow loop diagram | Target and Circular ...
- Social Intelligence Diagrams
- Product life cycle process - Flowchart | Intelligence analyst cycle ...
- Process Flowchart | Target and Circular Diagrams | Illustration ...
- Process Flowchart | AWS Architecture Diagrams | Workflow ...
- Process Flowchart | AWS Architecture Diagrams | Workflow ...
- Process Flowchart | Schematic Diagrams Of Social Intelligence
- Process Flowchart | Schematic Diagram Of Social Intelligence
- Process Flowchart | AWS Architecture Diagrams | Target and ...
- Social Intelligence Diagrams Illustrations
- The Circular Flow Diagram | Process Flowchart | Workflow Flowchart ...
- Flow Chart Diagram Of Intelligence Test
- Psychology Schematic Diagram Social Intelligence