A four level pyramid model of different types of Information Systems based on the different levels of hierarchy in an organization. The first level represents transaction processing systems for workers. The second level represents management information systems for middle managers. The third level represents decision support systems for senior menegers. The fourth level represents executive information systems for executives.
"The "classic" view of Information systems found in the textbooks in the 1980s was of a pyramid of systems that reflected the hierarchy of the organization, usually transaction processing systems at the bottom of the pyramid, followed by management information systems, decision support systems, and ending with executive information systems at the top. Although the pyramid model remains useful, since it was first formulated a number of new technologies have been developed and new categories of information systems have emerged, some of which no longer fit easily into the original pyramid model.
Some examples of such systems are:
data warehouses,
enterprise resource planning,
enterprise systems,
expert systems,
search engines,
geographic information system,
global information system,
office automation." [Information systems. Wikipedia]
This diagram was redesigned using the ConceptDraw PRO diagramming and vector drawing software from Wikimedia Commons file Four-Level-Pyramid-model.png. [commons.wikimedia.org/ wiki/ File:Four-Level-Pyramid-model.png]
This file is licensed under the Creative Commons Attribution-Share Alike 3.0 Unported license. [creativecommons.org/ licenses/ by-sa/ 3.0/ deed.en]
The triangle chart example "Information systems types" is included in the Pyramid Diagrams solution from the Marketing area of ConceptDraw Solution Park.
Pyramid diagram

Business diagrams & Org Charts with ConceptDraw DIAGRAM


 Continent Maps
Continent Maps solution extends ConceptDraw DIAGRAM software with templates, samples and libraries of vector stencils for drawing the thematic maps of continents, state maps of USA and Australia.
Think. Act. Accomplish.

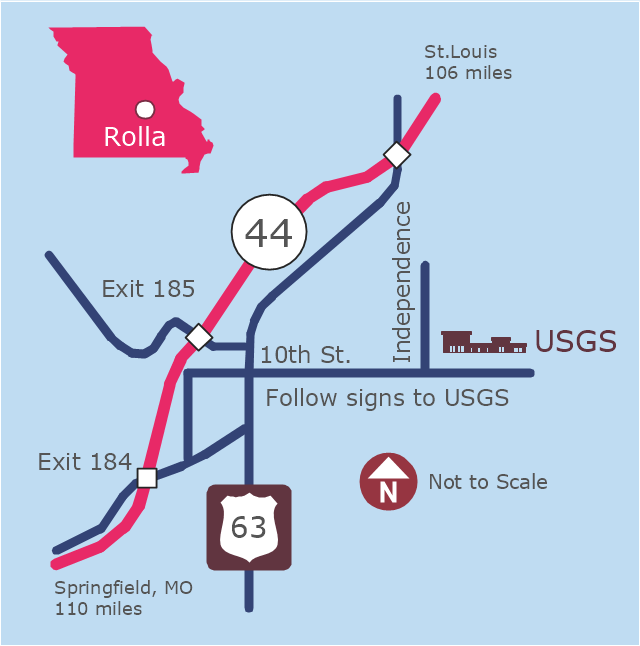
This example was created on the base of the locator map from the website of the Rolla USGS Center. "Rolla USGS Center.
The Rolla USGS is home to the National Geospatial Technical Operations Center, the Missouri Water Science Center, the National Spatial Data Infrastructure Partnership Office Liaisons, and the Rolla Science Information Services office. Employees at this location provide customers with geospatial, geographic, water, biologic and geologic products; science; data; and research, along with offering partnerships and contracting opportunities for local, state, federal, and private entities.
The National Geospatial Technical Operations Center (NGTOC) is a production, research, and data management facility for maps and digital cartographic data products. The work of the NGTOC supports planning and development activities; construction projects; scientific studies; resource management; and environmental monitoring activities, nationwide, at every level of government, academia, and the private sector. The NGTOC in Rolla, along with the other NGTOC site in Denver, plays a key operational role in supporting The National Map, US Topo, The National Atlas™ and all associated products and services, including national coverage of digital orthoimagery, digital elevation data, the National Hydrography Dataset, geographic names, public domain transportation, structures, and governmental units data, and topographic maps. Staff in the Center of Excellence for Geospatial Information Science (CEGIS) are also located in the NGTOC. ... Rolla Missouri Location Map The Rolla USGS Center is located in Rolla, Missouri. Rolla, the county seat of Phelps County, is an attractive mixture of rural and urban life. It is the home of several high-technology businesses and Federal agencies, including the U.S. Geological Survey and the U.S. Forest Service. Missouri University of Science and Technology, a nationally recognized leader in science and technology, has educated students in Rolla for more than 140 years.
Rolla is located at the crossroads of I-44, US 63 and Missouri Highway 72 and is a popular stop on Historic Route 66. Jefferson City, the state capital, is 62 miles to the north, St. Louis lies 106 miles northeast and Springfield is 110 miles southwest." [mcmcweb.er.usgs.gov]
The example "Rolla USGS Center locator map" was created using the ConceptDraw PRO diagramming and vector drawing software extended with the Directional Maps solution from the Maps area of ConceptDraw Solution Park.
Locator map
Collaboration in a Project Team

- 4 Level pyramid model diagram - Information systems types ...
- 4 Level pyramid model diagram - Information systems types | 5 Level ...
- 4 Level pyramid model diagram - Information systems types | 5 Level ...
- Managment Information System Triangles In Mis
- Information System Pyramid Diagram Example Situation
- 4 Level pyramid model diagram - Information systems types ...
- 4 Level pyramid model diagram - Information systems types | UML ...
- 4 Level pyramid model diagram - Information systems types ...
- Simple Diagram The Concept Of Information System
- 4 Level pyramid model diagram - Information systems types | Star ...
- 4 Level pyramid model diagram - Information systems types | How to ...
- Chart Of Management Information System With Diagram
- Diagrams Of Managenent Information System
- Various Levels Of Management Information System
- 4 Level pyramid model diagram - Information systems types | Chart ...
- Pyramid Diagram | 4 Level pyramid model diagram - Information ...
- 4 Level pyramid model diagram - Information systems types | Data ...
- Diagram Of Marketing Information System
- 4 Level pyramid model diagram - Information systems types