Process Flowchart


Bar Diagrams for Problem Solving. Create manufacturing and economics bar charts with Bar Graphs Solution

Types of Flowcharts


Flowchart Maker

Fault Tree Analysis Software

Example of DFD for Online Store (Data Flow Diagram) DFD Example


Easy Flowchart Program and Standard Flowchart Symbols

Process Flow Chart Symbols

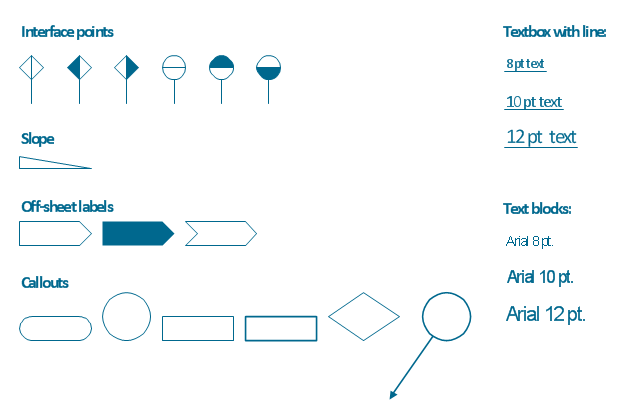
The vector stencils library "Process annotations" contains 22 symbols of interface points, slope, off-sheet labels, callouts and textboxes.
Use these shapes for setting automatic labels to display a datasheet field for a pipeline shape, labels, captions, outlines, off-sheet labels, text balloons, annotations, outlines, tags, and descriptions.
"In engineering a process is a set of interrelated tasks that, together, transform inputs into outputs. These tasks may be carried out by people, nature, or machines using resources; so an engineering process must be considered in the context of the agents carrying out the tasks, and the resource attributes involved. Systems Engineering normative documents and those related to Maturity Models are typically based on processes. For example, System Engineering processes of the EIA-632 and processes involved in the Capability Maturity Model Integration (CMMI) institutionalization and improvement approach. Constraints imposed on the tasks and resources required to implement them are essential for executing the tasks mentioned.
A chemical process is a series of unit operations used to produce a material in large quantities.
In the chemical industry, chemical engineers will use the following to define or illustrate a process:
Process Flow Diagram (PFD),
Piping and instrumentation diagram
(P&ID),
Simplified process description,
Detailed process description,
Project management,
Process simulation." [Process (engineering). Wikipedia]
The example "Design elements - Process annotations" was created using the ConceptDraw PRO diagramming and vector drawing software extended with the Chemical and Process Engineering solution from the Engineering area of ConceptDraw Solution Park.
Process annotation symbols
Sales Process Steps

Basic Diagramming


Flow chart Example. Warehouse Flowchart


Flow Diagram Software

Donut Chart Templates

Gane Sarson Diagram

- Industrial Control Systems
- Data Flow Diagram Symbols . DFD Library | Basic Flowchart ...
- Basic Flowchart Symbols and Meaning | Audit Flowchart Symbols ...
- Flowchart Input Symbol
- Basic Flowchart Symbols and Meaning | Process Flowchart | How to ...
- Basic Flowchart Symbols and Meaning | Process Flowchart ...
- Technical Flow Chart | Basic Flowchart Symbols and Meaning ...
- Basic Flowchart Symbols and Meaning | Process Flowchart ...
- Process Flowchart | How to Create Flowcharts for an Accounting ...
- Basic Flowchart Symbols and Meaning | Account Flowchart ...
- Basic Flowchart Symbols and Meaning | IDEF0 Flowchart Symbols ...
- Basic Flowchart Symbols and Meaning | Process Flowchart ...
- Basic Flowchart Symbols and Meaning | Process Flowchart ...
- Sample Process Flow Using Display Symbols
- Process Flow Diagram Symbols | Process Flowchart | Design ...
- Instrument Symbols
- Basic Flowchart Symbols and Meaning | Business Process Mapping ...
- Basic Flowchart Symbols and Meaning | Process Flowchart | Event ...
- Basic Flowchart Symbols and Meaning | Process Flowchart | Event ...
- Basic Flowchart Symbols and Meaning | Process Flowchart | Flow ...