Control and Information Architecture Diagrams (CIAD) with ConceptDraw DIAGRAM

Information Architecture
What Is Information Architecture
Information Technology Architecture
Garrett IA Diagrams with ConceptDraw DIAGRAM

Business Architecture
How To Create Professional Diagrams
Information Graphics
Pyramid Diagram

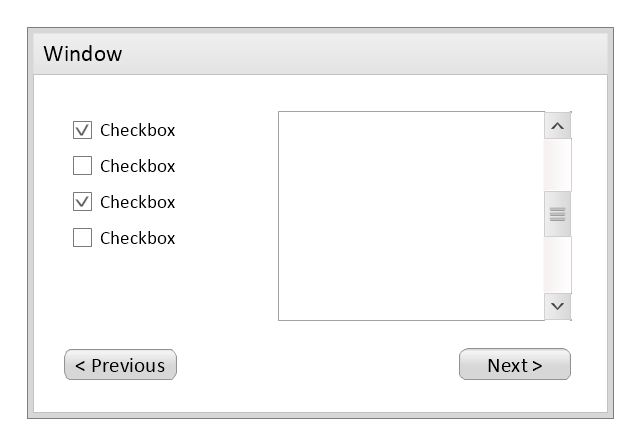
Use this template to prototype and design the wireframe graphic user interface (GUI).
"A website wireframe, also known as a page schematic or screen blueprint, is a visual guide that represents the skeletal framework of a website. Wireframes are created for the purpose of arranging elements to best accomplish a particular purpose. The purpose is usually being informed by a business objective and a creative idea. The wireframe depicts the page layout or arrangement of the website’s content, including interface elements and navigational systems, and how they work together. The wireframe usually lacks typographic style, color, or graphics, since the main focus lies in functionality, behavior, and priority of content. In other words, it focuses on what a screen does, not what it looks like. Wireframes can be pencil drawings or sketches on a whiteboard, or they can be produced by means of a broad array of free or commercial software applications. Wireframes are generally created by business analysts, user experience designers, developers, visual designers and other roles with expertise in interaction design, information architecture and user research.
Wireframes focus on:
(1) The kinds of information displayed.
(2) The range of functions available.
(3) The relative priorities of the information and functions.
(4) The rules for displaying certain kinds of information.
(5) The effect of different scenarios on the display.
The website wireframe connects the underlying conceptual structure, or information architecture, to the surface, or visual design of the website. Wireframes help establish functionality, and the relationships between different screen templates of a website. An iterative process, creating wireframes is an effective way to make rapid prototypes of pages, while measuring the practicality of a design concept. Wireframing typically begins between “high-level structural work - like flowcharts or site maps - and screen designs.” Within the process of building a website, wireframing is where thinking becomes tangible.
Aside from websites, wireframes are utilized for the prototyping of mobile sites, computer applications, or other screen-based products that involve human-computer interaction." [Website wireframe. Wikipedia]
The wireframe GUI template for the ConceptDraw PRO diagramming and vector drawing software is included in the Graphic User Interface solution from the Software Development area of ConceptDraw Solution Park.
Wireframe GUI template
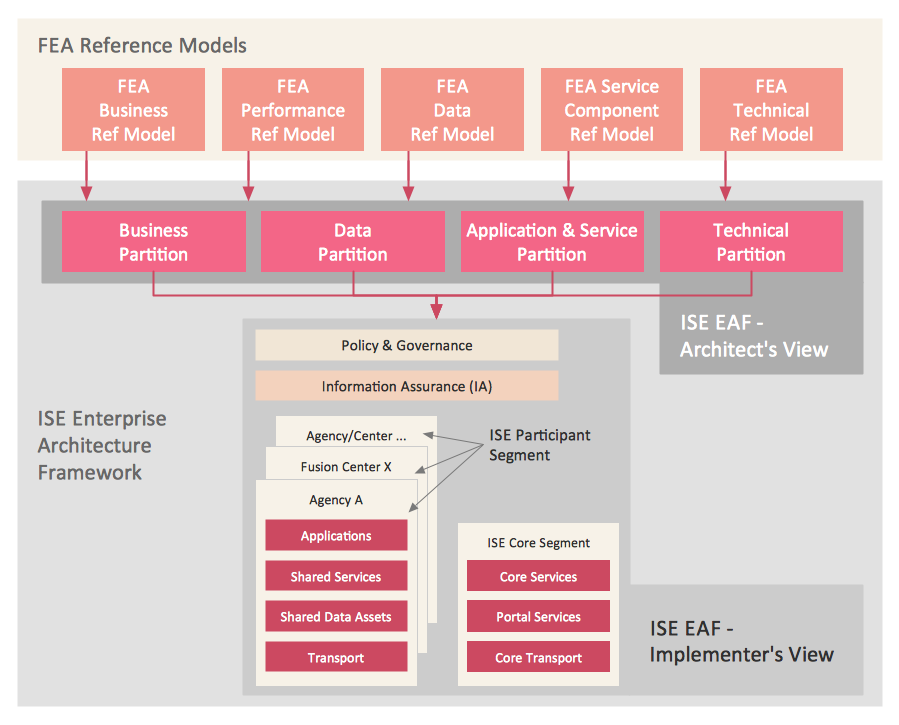
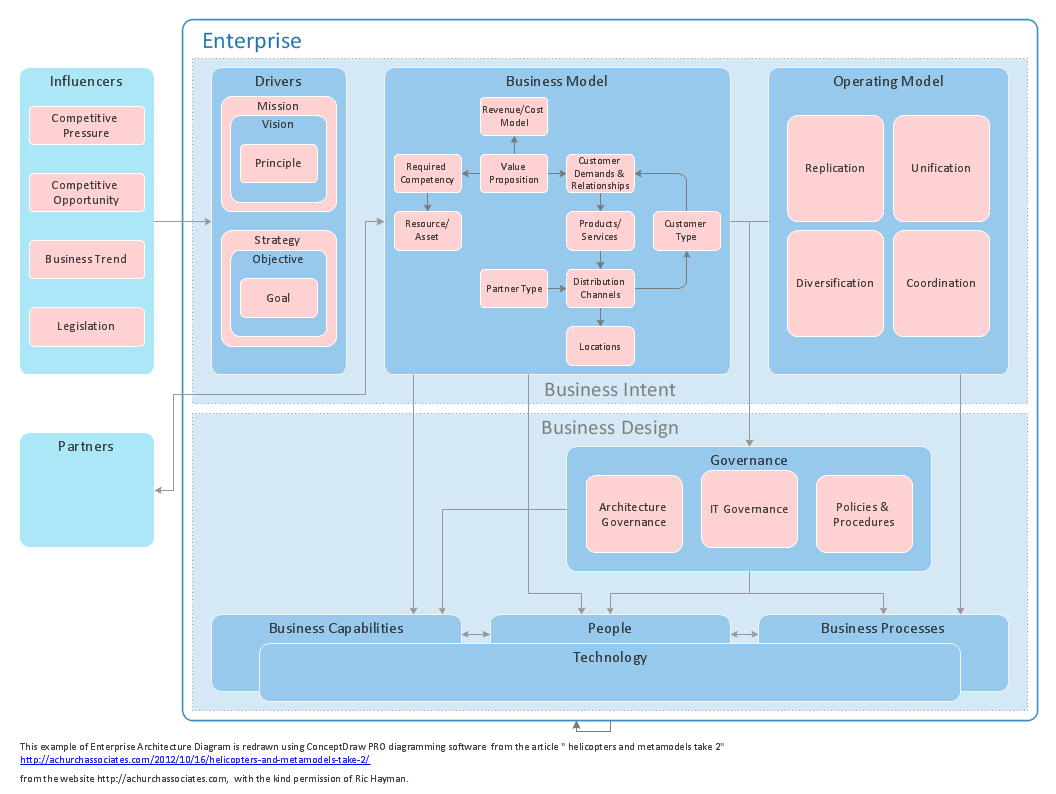
This enterprise architecture diagram sample was drawn on the base of the figure illustrating the webpage "Enterprise Architecture" from the United States Department of Agriculture (USDA) website.
"The USDA's Enterprise Architecture program strategically partners with all agencies to provide value to USDA's mission areas, business processes, and Information Technology (IT) capabilities.
Introduction.
The USDA Enterprise Architecture (EA) helps make sure information technology investments align with the mission and goals of the Department. It defines how information and technology should support USDA’s strategic goals and benefit the business.
Purpose.
The intent of the USDA Enterprise Architecture is to help make the information technology (IT) expenditures more effectively serve the mission and goals of the organization. Enterprise architecture defines how information and technology support USDA’s strategic planning to benefit our business. There are many ways to organize the information and diagrams that make up the architecture."
[ocio.usda.gov/ about-ocio/ governance-and-strategic-investment-gsi/ enterprise-architecture]
The enterprise architecture diagram example "USDA's Enterprise Architecture" was created using the ConceptDraw PRO diagramming and vector drawing software extended with the Enterprise Architecture Diagrams solution from the Management area of ConceptDraw Solution Park.
Enterprise architecture diagram
Amazon Web Services Diagrams diagramming tool for architecture

Pyramid Diagram

Diagramming Software for Design UML Collaboration Diagrams


Entity-Relationship Diagram (ERD) with ConceptDraw DIAGRAM


- Control and Information Architecture Diagrams (CIAD) with ...
- Information Architecture | Software Development | Control and ...
- Control and Information Architecture Diagrams (CIAD)
- USDA's Enterprise Architecture | Information Technology ...
- What Is Information Architecture | Planogram Software and Retail ...
- Information Architecture | What Is Information Architecture | Control ...
- Types of Flowcharts | Information Architecture | Network diagrams ...
- What Is Information Architecture | Account Flowchart Stockbridge ...
- Diagrammatic Illustration Of Information System Architecture
- What Is Information Architecture | Information Technology ...
- Enterprise Architecture Diagrams | Business Architecture ...
- Data Flow Diagram Architecture Example
- Drawing ER diagrams on a Mac | What Is Information Architecture ...
- Types of Flowcharts | What Is Information Architecture | IDEF9 ...
- Control and Information Architecture Diagrams (CIAD)
- Collaboration in a Project Team | Control and Information ...
- Software Development | Network Architecture | Control and ...
- Amazon Web Services Diagrams diagramming tool for architecture ...
- Design elements - Enterprise architecture diagram | BCG Matrix ...
- Information Architecture | Database Design Of Accomplishment ...