This site uses cookies. By continuing to browse the ConceptDraw site you are agreeing to our Use of Site Cookies.

Scatter Graph Charting Software

ConceptDraw provides some interactive xy chart and scatter graph symbols that offers advanced features yet is simple to use.

Entity-Relationship Diagram

Entity Relationship Diagram (ERD) is the world-known way to show the logical structure of databases in visual manner. The best software tool for drawing Entity-Relationship Diagram is ConceptDraw DIAGRAM vector graphics software with Entity-Relationship Diagram (ERD) solution from Software Development area which gives the ability to describe a database using the Entity-Relationship model. The vector graphic diagrams produced using this solution can be successfully used in whitepapers, presentations, datasheets, posters, or any technical materials.

Workflow Diagram Template
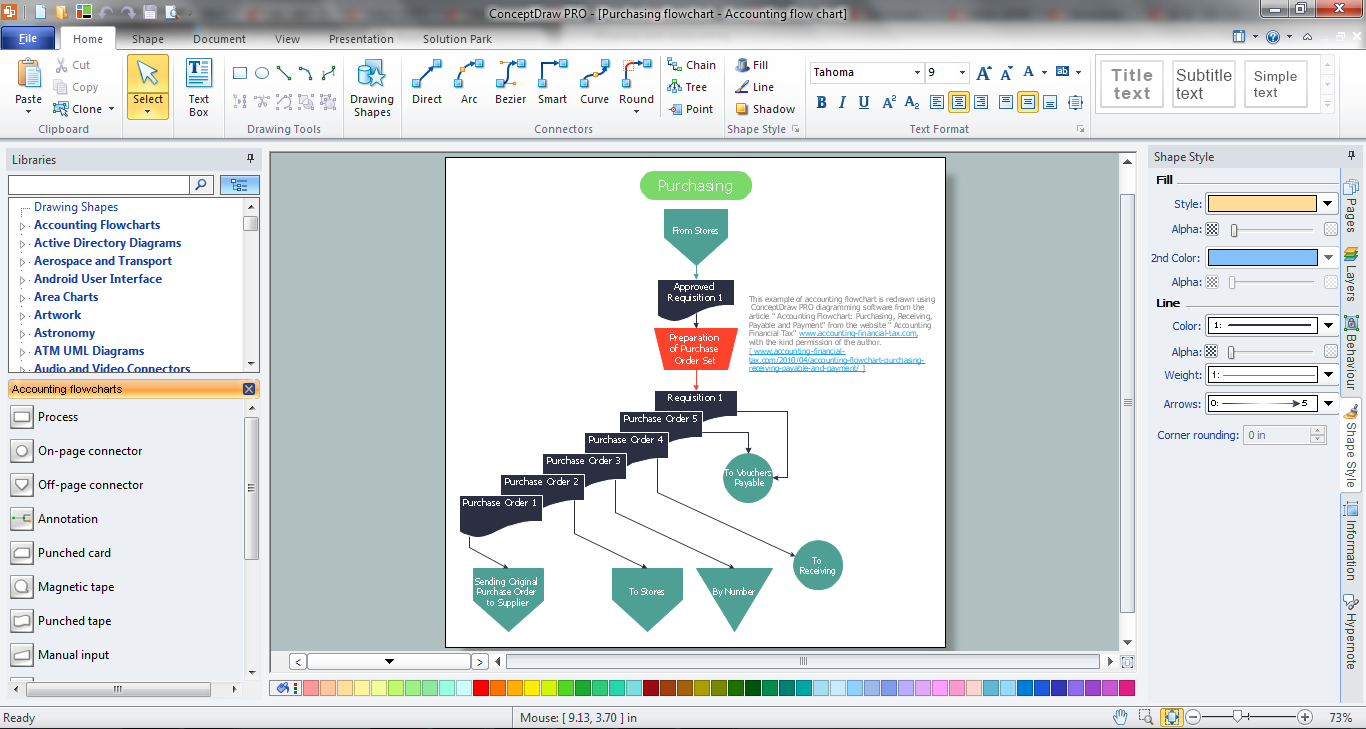
Starting producing workflow diagram from template you save time and avoid the blank page syndrome. At first, the workflow template is set of rules for a workflow. The workflow symbols used in the specific case are part of workflow template. This is the subset of large standard collections of workflow symbols. The first part of workflow template is identification of symbols allowed in use in your specific case. The best way would be to collect them in your customized drawing collection of workflow symbols which used in your specific cases of workflow diagrams. Another way to create business process documents is using business process flow diagram which have similar purposes and have different visual notation.

ConceptDraw DIAGRAM is professional workflow diagram software with the rich extentions from ConceptDraw Solution Park. The basic solution for workflow diagramming is Workflow Diagrams Solution. It delivers a rich set of workflow diagram templates and samples help you draw diagrams e

Accounting Process

Accounting is a powerful tool used for gaining quantitative information about the finances. The accounting process is a series of activities which begins with a transaction and ends with closing of books, and includes recording the income and expenditure of an organization.
ConceptDraw DIAGRAM diagramming and vector drawing software offers the Accounting Flowcharts Solution from the Finance and Accounting Area of ConceptDraw Solution Park which is perfect for accounting process visualization and for creation Accounting Process Flowcharts.

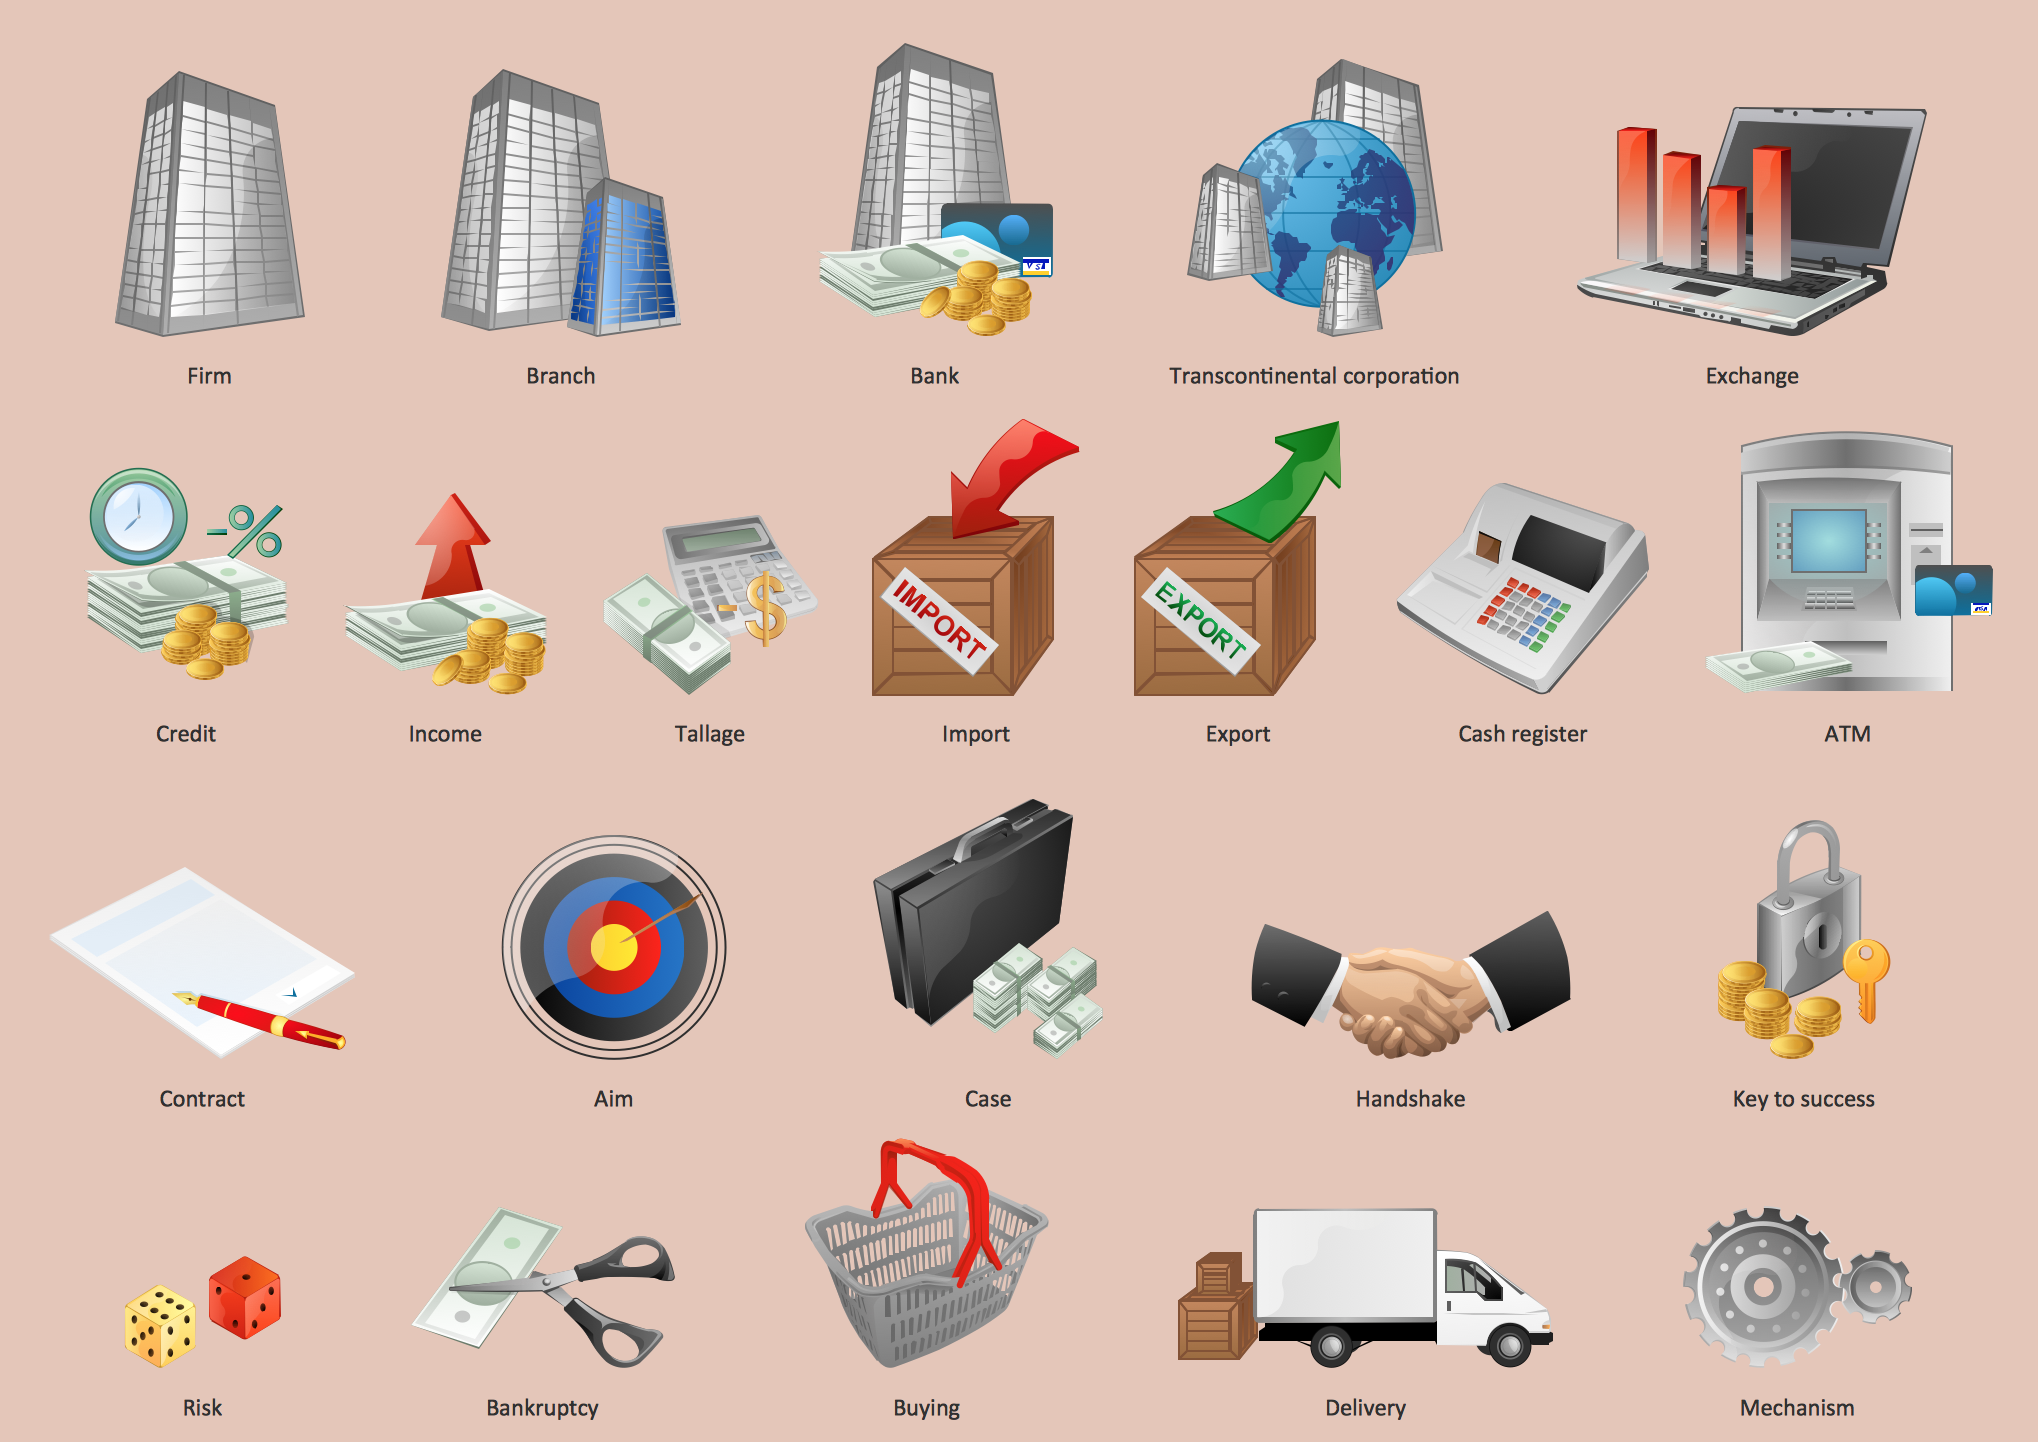
Business - Design Elements

Choose which of business design elements you love best.

Design your own style with Business and Finance Solutions from ConceptDraw DIAGRAM.

We created a full set of elements, business samples, templates and libraries with vector clip art for drawing the Business Illustrations.

Mark your report or presentation, pay an attention of audience on your drawings with vector business design elements.

Line Graph Charting Software

To design line and scatter charts use ConceptDraw DIAGRAM diagramming and vector drawing software extended with Line Graphs solution from Graphs and Charts area of ConceptDraw DIAGRAM Solution Park. (Line chart, scatter chart, 2d chart).

Scatter Graph

You've got to draw the Scatter Graph and look for the convenient tool which will help you? Direct your attention on the ConceptDraw DIAGRAM diagramming and vector drawing software extended with Scatter Diagrams Solution from the Graphs and Charts Area.

Accounting Data Flow from the Accounting Flowcharts Solution

Accounting Data Flow from the Accounting Flowcharts Solution visually describes the financial accounting process, shows the accumulated information about transactions and events for creating the balance sheet and the final income statement.
Accounting Flowcharts Solution contains also a wide variety of templates and samples that you can use as the base for your own Accounting Flowcharts of any complexity.

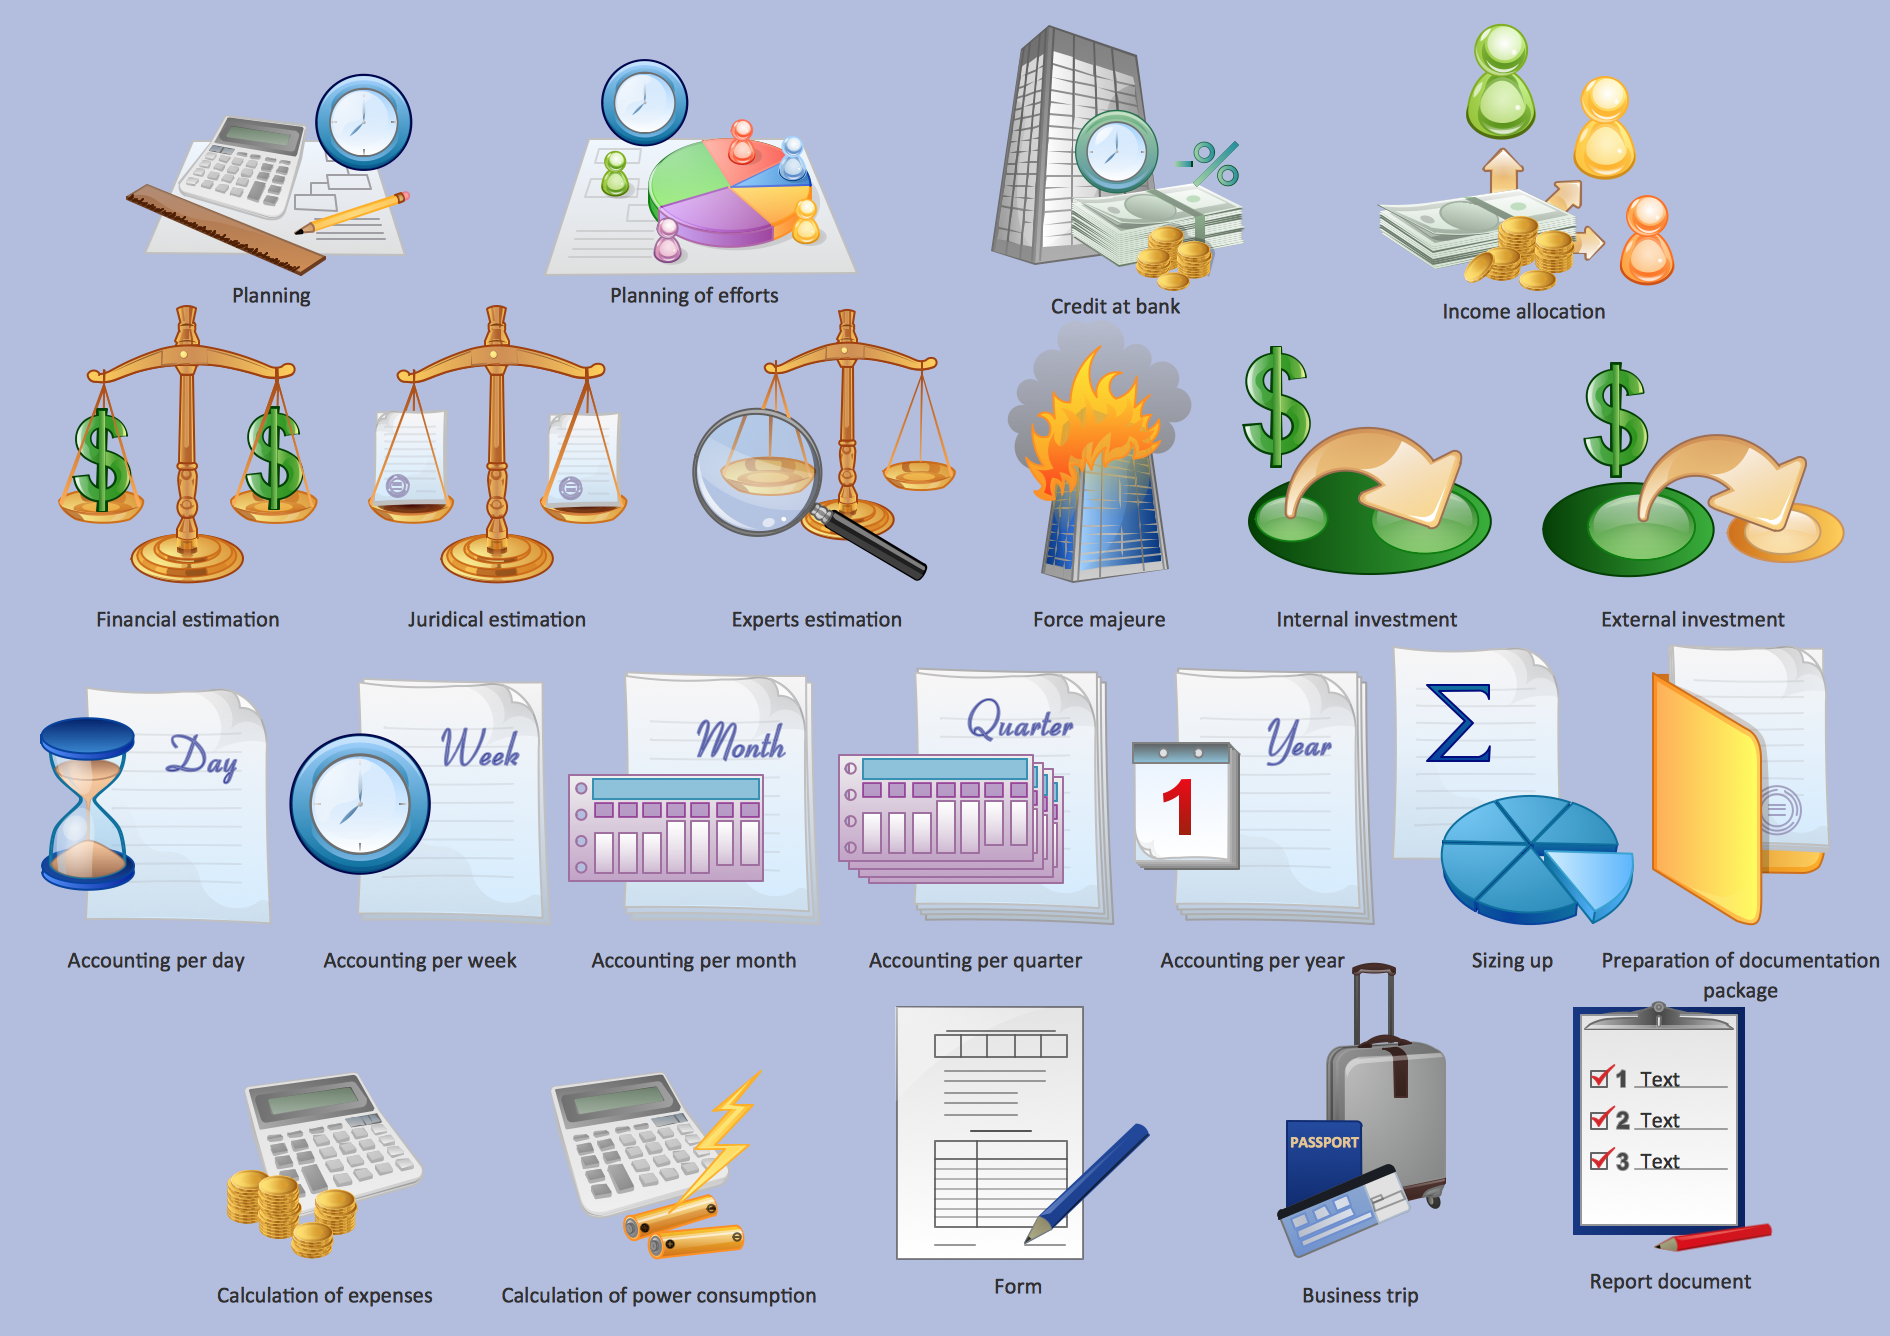
Management - Design Elements
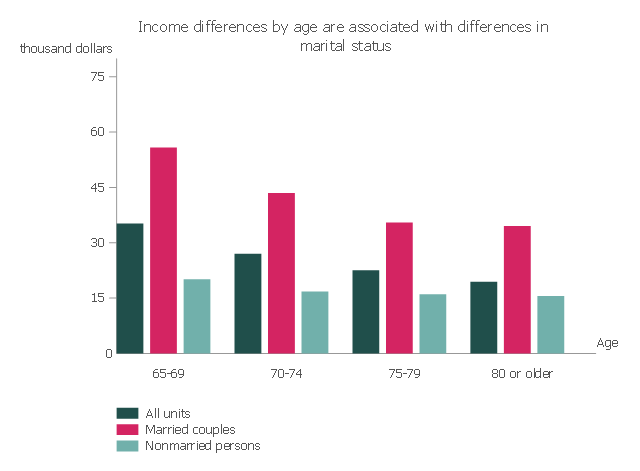
When you need to draw a professional management drawing, these management design elements, samples, templates and libraries with vector clip art for drawing the Marketing Illustrations. Conceptdraw symbols and signs you can use in your design for Strategic Management, Graphic Design, Planning implementation and more.

You can create and view impact analysis drawings from specific design elements to examine the tasks.

draw bar chart, draw bar graph, draw column chart Bar Graphs

draw bar chart, draw bar graph, draw column chart
The Bar Graphs solution enhances ConceptDraw DIAGRAM functionality with templates, numerous professional-looking samples, and a library of vector stencils for drawing different types of Bar Graphs, such as Simple Bar Graph, Double Bar Graph, Divided Bar Graph, Horizontal Bar Graph, Vertical Bar Graph, and Column Bar Chart.

Accounting Flowchart Symbols

If you deal everyday with accounting procedures, you might come to that point when you have to draw an accounting flowchart mentioning all the necessary details for getting the right result and in order to succeed in your field of business activity. Making it is truly simple in case you have ConceptDraw DIAGRAM which is a unique software that allows you to create any kinds of charts and flowcharts as well as schemes, diagrams and plans. This product is so special that once you start using it, you will understand the way it works quick and will never need any other software for the purpose of creating all mentioned above to see as a result incredible, smart, professional, sophisticated flowchart.
This vertical bar chart sample shows the income differences by age are associated with differences in marital status. It was designed on the base of the bar graph from the webpage "Income of the Aged Chartbook, 2008" on the website of the Social Security Administration, the U.S. Office of Retiriment and Disability Policy.
[ssa.gov/ policy/ docs/ chartbooks/ income_ aged/ 2008/ iac08.html]
"The United States Social Security Administration (SSA) is an independent agency of the United States federal government that administers Social Security, a social insurance program consisting of retirement, disability, and survivors' benefits. To qualify for most of these benefits, most workers pay Social Security taxes on their earnings; the claimant's benefits are based on the wage earner's contributions. Otherwise benefits such as Supplemental Security Income (SSI) are given based on need." [Social Security Administration. Wikipedia]
The column chart example "Median income, by age and marital status" was created using the ConceptDraw PRO diagramming and vector drawing software extended with the Bar Graphs solution from the Graphs and Charts area of ConceptDraw Solution Park.
Column chart
Column chart, vertical bar chart, column chart,

Geo Map - Africa - Benin

Benin, officially the Republic of Benin, is a country in West Africa. It is bordered by Togo to the west, by Nigeria to the east and by Burkina Faso and Niger to the north.
The vector stencils library Benin contains contours for ConceptDraw DIAGRAM diagramming and vector drawing software. This library is contained in the Continent Maps solution from Maps area of ConceptDraw Solution Park.

Chart Templates

Easy charting software comes with beautiful chart templates and examples. This makes it easy to create professional charts without prior experience.

Polar Graph

This sample shows the Polar Graph. The Polar Graph is a graph in the polar coordinate system in which the each point on the plane is defined by two values - the polar angle and the polar radius. The certain equations have very complex graphs in the Cartesian coordinates, but the application of the polar coordinate system allows usually produce the simple Polar Graphs for these equations.