Business Calendar

Building Drawing Software for Design Sport Fields


Blank Calendar Template

The vector stencils library "Apps icons" contains 24 icons of iOS 8 / iPhone 6 applications: Messages, Calendar, Photos, Camera, Weather, Clock, Maps, Videos, Notes, Reminders, Stocks, Game Center, Newsstand, iTunes Store, App Store, iBooks, Health, Passbook, Settings, Phone, Mail, Music, Safari.
Use it to design iOS 8 apps GUI prototypes and iPhone 6 applications user interface sketches and mockups.
"iOS 8 is the eighth major release of the iOS mobile operating system designed by Apple Inc. as the successor to iOS 7. It was announced at the company's Worldwide Developers Conference (WWDC) 2014 on June 2, 2014 and will be released on September 17, 2014.
A new app named Health and a corresponding framework named HealthKit will be available. Siri will support hands-free activation and music identification using Shazam. Voice and video messages will be automatically deleted unless the user saves them for future reference. Interactive notifications will let the user respond to texts without leaving the app they are currently using." [iOS 8. Wikipedia]
The example "Design elements - Apps icons" was created using the ConceptDraw PRO diagramming and vector drawing software extended with the iPhone User Interface solution from the Software Development area of ConceptDraw Solution Park.
iOS 8 apps icons
 Calendars
Calendars solution extends ConceptDraw DIAGRAM software with templates, samples and library of vector stencils for drawing the business calendars and schedules.
Aircraft - Design Elements

"The iPhone ... is a line of smartphones designed and marketed by Apple Inc. It runs Apple's iOS mobile operating system. ...
The interface is based around the home screen, a graphical list of available applications. iPhone applications normally run one at a time. Starting with the iPhone 4, a primitive version of multitasking came into play. Users could double click the home button to select recently opened. However, the apps never ran in the background. Starting with iOS 7, though, apps can truly multitask, and each open application runs in the background when not in use, although most functionality is still available when making a call or listening to music. The home screen can be accessed at any time by a hardware button below the screen, closing the open application in the process.
By default, the Home screen contains the following icons: Messages (SMS and MMS messaging), Calendar, Photos, Camera, YouTube, Stocks, Maps (Google Maps), Weather, Voice Memos, Notes, Clock, Calculator, Settings, iTunes (store), App Store, (on the iPhone 3GS and iPhone 4) Compass, FaceTime and GameCenter were added in iOS 4.0 and 4.1 respectively. In iOS 5, Reminders and Newsstand were added, as well as the iPod application split into separate Music and Videos applications. iOS 6 added Passbook as well as an updated version of Maps that relies on data provided by TomTom as well as other sources. iOS 6 also added a Clock application onto the iPad's homescreen. However, it also no longer support YouTube. Docked at the base of the screen, four icons for Phone, Mail, Safari (Internet), and Music delineate the iPhone's main purposes." [iPhone. Wikipedia]
The example "iPhone OS (iOS) graphic user interface (GUI) - SMS application" was created using the ConceptDraw PRO diagramming and vector drawing software extended with the Graphic User Interface solution from the Software Development area of ConceptDraw Solution Park.
iPhone GUI
-graphic-user-interface-(gui)---sms-application.png--diagram-flowchart-example.png)
Baseball Diagram – Colored Baseball Field

Business diagrams & Org Charts with ConceptDraw DIAGRAM


This template contains iPhone home screen with app icons.
Use it to design iPhone software applications user interface sketches, mockups and prototypes.
The template "iOS 8 / iPhone 6 home screen" for the ConceptDraw PRO diagramming and vector drawing software is included in the iPhone User Interface solution from the Software Development area of ConceptDraw Solution Park.
iPhone home screen with app icons
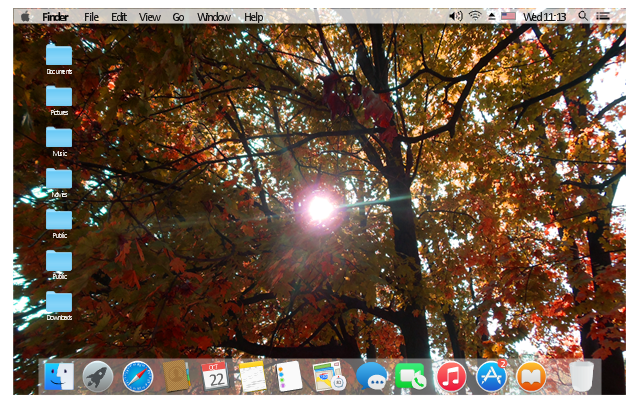
The example "OS X 10.10 Yosemite home screen" shows usage of menu bar, app icons and wallpapers user interface (UI) design elements.
The Mac graphic user interface (GUI) example "OS X 10.10 Yosemite home screen" was created using the ConceptDraw PRO diagramming and vector drawing software extended with the Mac OS User Interface solution from the Software Development area of ConceptDraw Solution Park.
The Mac graphic user interface (GUI) example "OS X 10.10 Yosemite home screen" was created using the ConceptDraw PRO diagramming and vector drawing software extended with the Mac OS User Interface solution from the Software Development area of ConceptDraw Solution Park.
OS X Yosemite UI design
Cisco Buildings. Cisco icons, shapes, stencils and symbols

 Timeline Diagrams
Timeline Diagrams solution extends ConceptDraw DIAGRAM diagramming software with samples, templates and libraries of specially developed smart vector design elements of timeline bars, time intervals, milestones, events, today marker, legend, and many other elements with custom properties, helpful for professional drawing clear and intuitive Timeline Diagrams. Use it to design simple Timeline Diagrams and designate only the main project stages, or highly detailed Timeline Diagrams depicting all project tasks, subtasks, milestones, deadlines, responsible persons and other description information, ideal for applying in presentations, reports, education materials, and other documentation.
Gantt charts for planning and scheduling projects

Quick Recipes

UML Class Diagram Example - Buildings and Rooms

Telecommunications Networks

Create a Floor Plan

Cisco Multimedia, Voice, Phone. Cisco icons, shapes, stencils and symbols

- Economic Calendar | Cisco Design | Free Calendar Printing Software
- Computer Network Diagrams | Free Calendar Printing Program
- Business Calendar | Calendars | Free Design Software For Calendars
- App icons - Vector stencils library | Design elements - Apps icons ...
- Design elements - Apps icons | iOS 8 / iPhone 6 home screen ...
- App icons | Design elements - Apps icons | Ios Calendar Icon Png
- Design elements - Apps icons | App icons - Vector stencils library ...
- App icons - Vector stencils library | iPhone OS (iOS) graphic user ...
- Design elements - Apps icons | Notification Center | iPhone OS (iOS ...