How to show a mind map presentation via Skype
Group Collaboration Software

 ConceptDraw Dashboard for Facebook
ConceptDraw Dashboard for Facebook solution extends ConceptDraw DIAGRAM software with a dynamically updated visual dashboard, which shows lifetime total likes, daily friends of fans, and daily page views, information you can receive from Facebook Insights.
Language School E-Learning

 Dashboards Area
Solutions from the area Dashboards of ConceptDraw Solution Park collects templates, samples and vector stencils libraries with of data driven charts and indicators for drawing the basic types of Visual Dashboards.
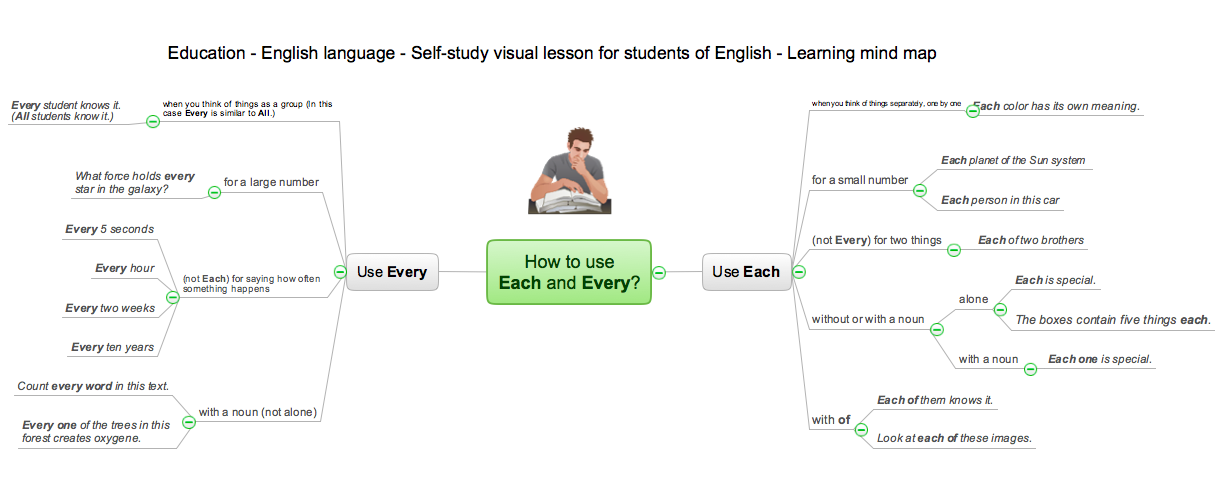
eLearning: Speaking English
 Collaboration Area
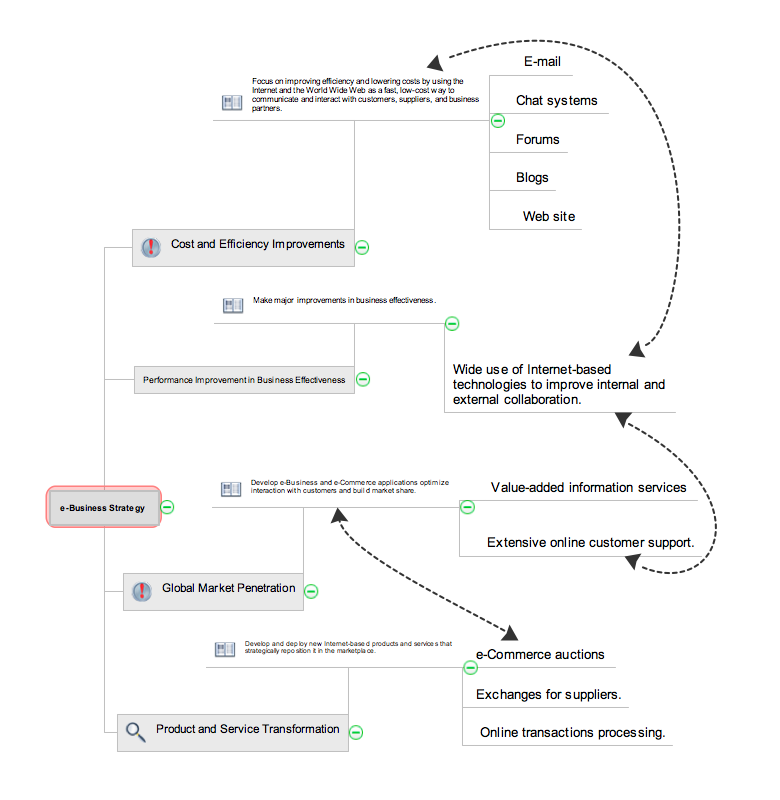
The solutions from Collaboration area of ConceptDraw Solution Park extend ConceptDraw DIAGRAM and ConceptDraw MINDMAP software with features, samples, templates and vector stencils libraries for drawing diagrams and mindmaps useful for collaboration.
 Correlation Dashboard
Correlation dashboard solution extends ConceptDraw DIAGRAM software with samples, templates and vector stencils library with Scatter Plot Charts for drawing the visual dashboard visualizing data correlation.
 Composition Dashboard
Composition dashboard solution extends ConceptDraw DIAGRAM software with templates, samples and vector stencils library with charts and indicators for drawing visual dashboards showing data composition.
 Frequency Distribution Dashboard
Frequency distribution dashboard solution extends ConceptDraw DIAGRAM software with samples, templates and vector stencils libraries with histograms and area charts for drawing the visual dashboards showing frequency distribution of data.
 Spatial Dashboard
Spatial dashboard solution extends ConceptDraw DIAGRAM software with templates, samples and vector stencils libraries with thematic maps for drawing visual dashboards showing spatial data.
 Time Series Dashboard
Time series dashboard solution extends ConceptDraw DIAGRAM software with templates, samples and vector stencils libraries with charts, graphs and plots for drawing the visual dashboards showing data time series.
Flowchart Software


 PM Dashboards
The PM Dashboards solution extends the management boundaries of ConceptDraw DIAGRAM and ConceptDraw PROJECT products with an ability to demonstrate changes to the budget status, to show the project progress toward its objectives, to display clearly the identified key performance indicator (KPI) or the set of key performance indicators for any project. This solution provides you with examples and ability to generate three types of visual dashboards reports based on your project data Project Dashboard, Tactical Dashboard, and Radar Chart. By dynamically charting the project’s key performance indicators that are collected on one ConceptDraw DIAGRAM document page, all project participants, project managers, team members, team leaders, stakeholders, and the entire organizations, for which this solution is intended, have access to the daily status of projects they are involved in.
 Comparison Dashboard
Comparison dashboard solution extends ConceptDraw DIAGRAM software with samples, templates and vector stencils library with charts and indicators for drawing the visual dashboard comparing data.
- Exchange Mind Map with Evernote | How To Implement ...
- Concept map - Risk management | Seven Management and ...
- Collaboration Software | ConceptDraw.com
- Marketing | SWOT analysis matrix diagram templates | Comparison ...
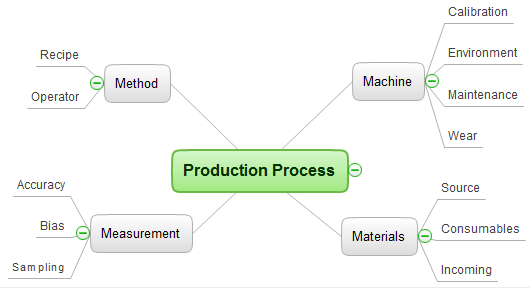
- Computer and Networks | Fishbone Diagram | Business Process ...
- Venn diagram - Internet marketing professions | Satellite telecom ...
- Venn diagram - Internet marketing professions | Satellite network ...
- Design elements - Histograms | Histogram template | Design ...
- GPS operation diagram | Mobile satellite TV network diagram | Bar ...
- How To Create Home Plan with Examples | Restaurant Floor Plans ...
- Network diagrams with ConceptDraw PRO | Computer and Networks
- Process decision program chart (PDPC) - Personal activity ...
- Network Diagram Software LAN Diagrams | Create Professional ...
- Cause and Effect Analysis (Fishbone Diagrams) | TQM Diagram ...
- How To Create Restaurant Floor Plans in Minutes
- How To use Kitchen Design Software | Remodel ... - Conceptdraw.com
- Network Diagram Software Local Area Network | Network Diagram ...
- Block Diagrams | Basic Diagramming | Universal Diagramming Area |
- How To use Kitchen Design Software | Remodel Kitchen | Design ...