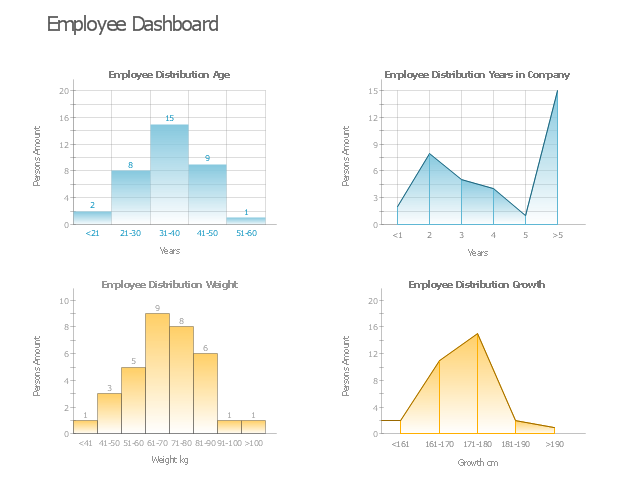
This HR dashboard example include histograms "Employee Distribution by Age" and "Employee Distribution by Weight", and area charts "Employee Distribution by Years in Company" and "Employee Distribution by Growth".
"Human resources is the set of individuals who make up the workforce of an organization, business sector, or economy. "Human capital" is sometimes used synonymously with human resources, although human capital typically refers to a more narrow view (i.e., the knowledge the individuals embody and can contribute to an organization). Likewise, other terms sometimes used include "manpower", "talent", "labour", or simply "people". The professional discipline and business function that oversees an organization's human resources is called human resource management (HRM, or simply HR)." [Human resources. Wikipedia]
The example "HR dashboard" was created using the ConceptDraw PRO diagramming and vector drawing software extended with the Frequency Distribution Dashboard solution from the area "What is a Dashboard" of ConceptDraw Solution Park.
Visual dashboard
 ConceptDraw Dashboard for Facebook
ConceptDraw Dashboard for Facebook solution extends ConceptDraw DIAGRAM software with a dynamically updated visual dashboard, which shows lifetime total likes, daily friends of fans, and daily page views, information you can receive from Facebook Insights.
 HR Flowcharts
Human resource management diagrams show recruitment models, the hiring process and human resource development of human resources.
 Comparison Dashboard
Comparison dashboard solution extends ConceptDraw DIAGRAM software with samples, templates and vector stencils library with charts and indicators for drawing the visual dashboard comparing data.
Visual Presentations Made Easy with Diagramming Software


 Business Intelligence Dashboard
Business Intelligence Dashboard solution extends the ConceptDraw DIAGRAM functionality with exclusive tools, numerous ready-to-use vector objects, samples and quick-start templates for creation professional Business Intelligence Dashboards, Business Intelligence Graphics, Business Intelligence Charts and Maps of different kinds. Design easy the BI dashboard, BI model or Dynamic chart in ConceptDraw DIAGRAM to monitor the company's work, to track the indicators corresponding your company's data, to display and analyze key performance indicators, to evaluate the trends and regularities of the processes occurring at the company.
 PM Dashboards
The PM Dashboards solution extends the management boundaries of ConceptDraw DIAGRAM and ConceptDraw PROJECT products with an ability to demonstrate changes to the budget status, to show the project progress toward its objectives, to display clearly the identified key performance indicator (KPI) or the set of key performance indicators for any project. This solution provides you with examples and ability to generate three types of visual dashboards reports based on your project data Project Dashboard, Tactical Dashboard, and Radar Chart. By dynamically charting the project’s key performance indicators that are collected on one ConceptDraw DIAGRAM document page, all project participants, project managers, team members, team leaders, stakeholders, and the entire organizations, for which this solution is intended, have access to the daily status of projects they are involved in.
Data Visualization Software Solutions

 PM Planning
The PM Planning solution extends the functional abilities of ConceptDraw MINDMAP and ConceptDraw PROJECT software, allowing to automatically create the spreadsheets reflecting the tasks and project statuses for people who have different project roles. The reporting capabilities of this solution are represented by the possibility to generate a wide range of project reports that allow the project managers, senior management and other project participants to be informed on a project daily progress and monthly objectives: All Inclusive Report, All Visible Columns, Milestones with Notes and Objectives, Projects Goals, Projects Managers, Project Team, and Top Level Tasks. The PM Planning solution from ConceptDraw Solution Park is a strong project management and productivity tool which simplifies the process of reporting and lets one create a document with the desired report, includes the predesigned examples, extends and improves the planning capabilities for all team members, improves the project communication, helps to accurately plan, maintain, and finish projects on time, to track the work of project resources, to perform the analytical work and to make effective decisions.
Visualize Sales Data Using Sample Data

 Android User Interface
The Android User Interface solution allows ConceptDraw DIAGRAM act as an Android UI design tool. Libraries and templates contain a variety of Android GUI elements to help users create images based on Android UI design.
 ConceptDraw Solution Park
ConceptDraw Solution Park collects graphic extensions, examples and learning materials
 Office Layout Plans
Office layouts and office plans are a special category of building plans and are often an obligatory requirement for precise and correct construction, design and exploitation office premises and business buildings. Designers and architects strive to make office plans and office floor plans simple and accurate, but at the same time unique, elegant, creative, and even extraordinary to easily increase the effectiveness of the work while attracting a large number of clients.
Business Diagram Software


- Status Dashboard | Construction Project Chart Examples | How to ...
- Hr Dashboard In Excel
- Gant Chart in Project Management | Projects HR dashboard | How to ...
- HR dashboard | Projects HR dashboard | Employee distribution - HR ...
- Employee distribution - HR dashboard | How to Create a HR ...
- Human Resource Dashboard Example
- Employee distribution - HR dashboard | HR dashboard | Frequency ...
- Employee distribution - HR dashboard | Projects HR dashboard | HR ...
- Employee distribution - HR dashboard | HR dashboard | Projects HR ...
- Hr Dashboard Excel Free Download
- HR dashboard | Project tasks dashboard | How to Supervise People ...
- HR dashboard | Frequency Distribution Dashboard | Time Series ...
- Employee distribution - HR dashboard | Frequency Distribution ...
- Business Intelligence Dashboard Software | How to Create ...
- Sales Dashboards for Your Company | Bar Graphs | Projects HR ...
- Hr Analytics Dashboard Excel Free Download
- Data Visualization Software Solutions | PM Dashboards | Sales ...
- Hr Kpis Dashboard
- HR dashboard | Projects HR dashboard | Frequency Distribution ...
- Hr Dashboard Manufacturing
- ERD | Entity Relationship Diagrams, ERD Software for Mac and Win
- Flowchart | Basic Flowchart Symbols and Meaning
- Flowchart | Flowchart Design - Symbols, Shapes, Stencils and Icons
- Flowchart | Flow Chart Symbols
- Electrical | Electrical Drawing - Wiring and Circuits Schematics
- Flowchart | Common Flowchart Symbols
- Flowchart | Common Flowchart Symbols