This cause and effect diagram sample was redesigned from the Wikimedia Commons file: Ursache Wirkung Diagramm Beispiel.png. [commons.wikimedia.org/ wiki/ File:Ursache_ Wirkung_ Diagramm_ Beispiel.png]
This file is licensed under the Creative Commons Attribution-Share Alike 3.0 Unported license. [creativecommons.org/ licenses/ by-sa/ 3.0/ deed.en]
"Productivity is the ratio of output to inputs in production; it is an average measure of the efficiency of production. Efficiency of production means production’s capability to create incomes which is measured by the formula real output value minus real input value.
Productivity is a crucial factor in production performance of firms and nations. Increasing national productivity can raise living standards because more real income improves people's ability to purchase goods and services, enjoy leisure, improve housing and education and contribute to social and environmental programs. Productivity growth also helps businesses to be more profitable." [Productivity. Wikipedia]
The fishbone diagram example "Increase in productivity" was created using the ConceptDraw PRO diagramming and vector drawing software extended with the Fishbone Diagrams solution from the Management area of ConceptDraw Solution Park.
Ishikawa diagram

Business Process Modeling Software for Mac

Work Order Process Flowchart. Business Process Mapping Examples

Planogram Software and Retail Plan Software

Horizontal Orgchart

Sales Process Flowchart Symbols

Flowchart Software

Business process Flow Chart — Event-Driven Process chain (EPC) diagrams

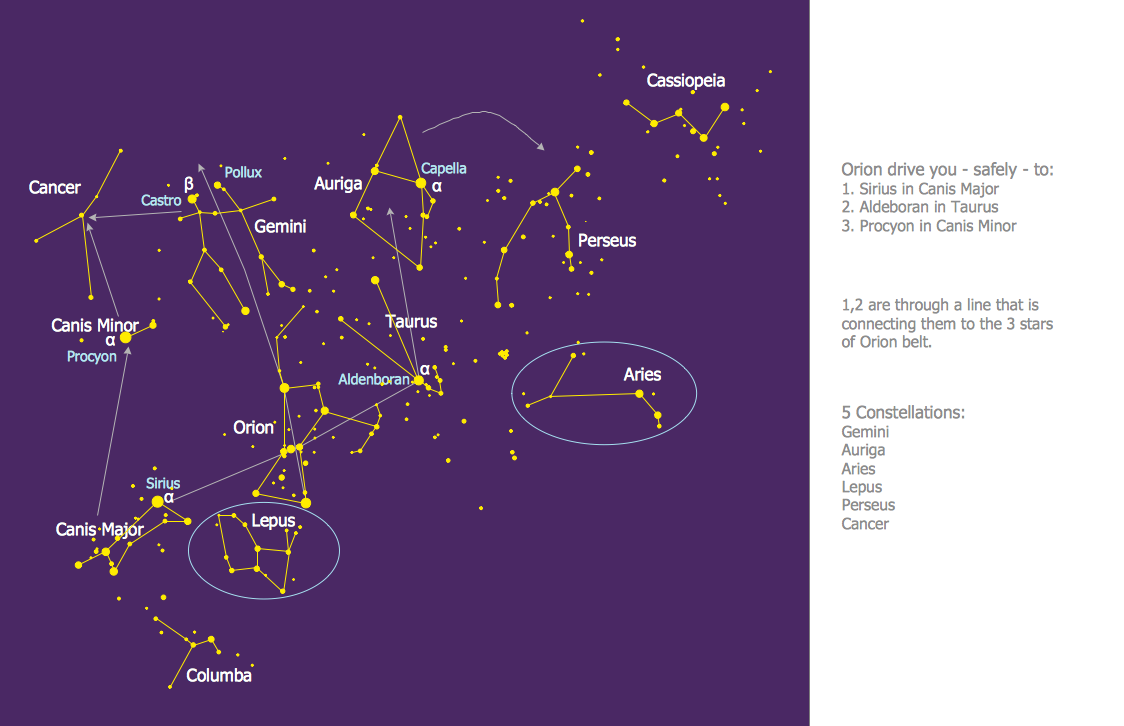
Constellation Chart
Block Diagram Software

Swim Lane Diagrams

Bar Diagrams for Problem Solving. Create space science bar charts with Bar Graphs Solution

Pyramid Chart Examples

- Cause and effect diagram - Increase in productivity | Total Quality ...
- Cause And Effect Diagrams
- Quality Management Teams | Schedule pie chart - Daily action plan ...
- How To Create Restaurant Floor Plan in Minutes | Home area ...
- How To Create Restaurant Floor Plan in Minutes | Store Layout ...
- Home area networks (HAN). Computer and Network Examples ...
- Store Layout Software | Interior Design Machines and Equipment ...
- 3D Network Diagram Software | Home area networks (HAN ...
- How to Draw a Floor Plan for Your Office | Army Flow Charts ...
- Guesthouse Network. WIFI network to my guest house | Home area ...
- Design elements - Management pictograms | Management ...
- How to Draw a Floor Plan for Your Office | Business diagrams & Org ...
- How To Create Restaurant Floor Plan in Minutes | Store Layout ...
- How To Draw Building Plans | Office Layout | Building Drawing ...
- Business diagrams & Org Charts with ConceptDraw PRO | Trading ...
- Interior Design Machines and Equipment - Design Elements ...
- Store Layout Software | Business diagrams & Org Charts with ...
- Business diagrams & Org Charts with ConceptDraw PRO ...
- Office Layout Plans | Office Layout | How to Draw a Floor Plan for ...
- How To Draw Building Plans | Building Drawing Software for Design ...