This site uses cookies. By continuing to browse the ConceptDraw site you are agreeing to our Use of Site Cookies.

Process Flowchart

ConceptDraw is Professional business process mapping software for making process flow diagram, workflow diagram, general flowcharts and technical illustrations for business documents. It is includes rich examples, templates, process flowchart symbols. ConceptDraw flowchart maker allows you to easier create a process flowchart. Use a variety of drawing tools, smart connectors, flowchart symbols and shape libraries to create flowcharts of complex processes, process flow diagrams, procedures and information exchange.
How To Create a Process Flow Chart (business process modelling techniques)

Online Diagram Tool

ConceptDraw PRO diagramming and vector drawing software extended with Rapid UML Solution from the Software Development Area is a powerful online diagram tool that will help you design any types of UML diagrams simply and fast.

Design Element: Crows Foot for Entity Relationship Diagram - ERD

Creating an ERD requires choosing a specific set of notations that best serve the specific database being designed. ConceptDraw PRO software extended with Entity-Relationship Diagram (ERD) solution from Software Development area of ConceptDraw Solution Park allows you to draw ER diagrams for depicting a database using the ERD diagram design element Crow's Foot - Crow′s Foot notation icons.

ORM Diagram

The vector stencils library ORM Diagrams from the solution Software Development contains specific ORM symbols for ConceptDraw PRO diagramming and vector drawing software. The Software Development solution is contained in the ConceptDraw Solution Park.

UML Activity Diagram. Design Elements

UML Activity Diagram illustrate the business and operational step-by-step workflow of components in a system and shows the overall flow of control.

Types of Flowchart - Overview

When designing a process or an instruction in clear way, you should consider creating a flowchart. A Process Flow Diagram is the method. You can avoid wasting a lot of time understanding complex concepts as they get clear with different diagrams.
How to Simplify Flow Charting

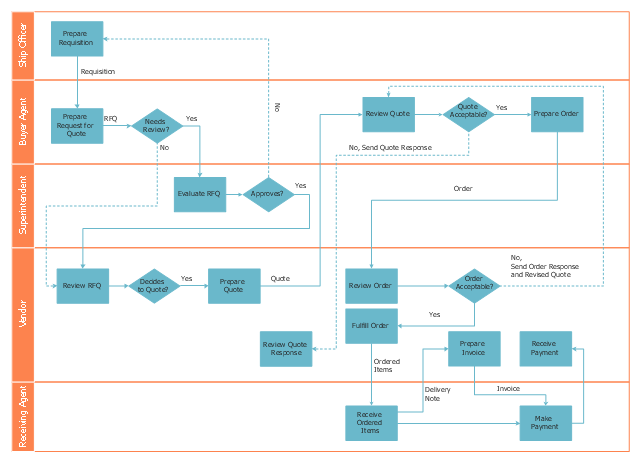
Cross-Functional Flowchart (Swim Lanes)

ConceptDraw PRO diagramming software provides vector shapes and connector tools for quick and easy drawing diagrams for business, technology, science and education.
Use flowchart maker of ConceptDraw PRO enhanced with solutions from ConceptDraw Solution Park to create diagrams to present and explain structures, process flows, logical relationships, networks, design schemes and other visually organized information and knowledge.

How To use House Electrical Plan Software

House Electrical Plan Software for creating great-looking home floor, electrical plan using professional electrical symbols.
You can use many of built-in templates, electrical symbols and electical schemes examples of our House Electrical Diagram Software.
ConceptDraw is a fast way to draw: Electrical circuit diagrams, Schematics, Electrical Wiring, Circuit schematics, Digital circuits, Wiring in buildings, Electrical equipment, House electrical plans, Home cinema, Satellite television, Cable television, Closed-circuit television.
House Electrical Plan Software works across any platform, meaning you never have to worry about compatibility again. ConceptDraw PRO allows you to make electrical circuit diagrams on PC or macOS operating systems.
Create an Electrical Diagram

Organogram Software

Organizing process is the process of creating the organizational structure of an enterprise. The organizing process consists of several stages. First, you need to divide the organization into departments, respectively to strategies, and then establish relationships of authority. After that, managing director delegates his rights and authorities.

Flow chart Example. Warehouse Flowchart

Warehouse Flowcharts are different diagrams describing wharehousing and inventory menagement processes. Typical purposes of warehouse flowcharts are evaluating warehouse performance and organizational performance, measuring efficiency of customer service. This type of workflow diagrams can be used for identifying any disconnection between business activities and business objectives.
Standard warehousing process flow diagram and standard workflow diagram used for process identification for further evaluating effectiveness and profitability of overall business process. Use the ConceptDraw PRO diagramming and vector drawing software extended with the Flowcharts solution from the Diagrams area of ConceptDraw Solution Park to design your own workflow diagrams, process flow diagram and flow charts. Need to use Process Flow Diagram for designing Warehouse packages flow.
ConceptDraw Arrows10 Technology

Pyramid Diagram

Pyramid diagrams help you visualize information as a triangle divided into horizontal slices. Labelled slices represent a hierarchy. Pyramids are used in marketing presentations to show and analyze hierarchy levels.
3D triangular diagram of DIKW pyramid has 6 levels: measurement, facts, data, information, knowledge, wisdom.
The data component include different scattered signs or symbols which are merely useless until these random objective facts are somehow processed. Data is a resource which has to be manipulated or rearranged to get useful. Information can be extracted from a pile of data, it also can be mined from different data storages.

Sales Process Flowcharts

ConceptDraw PRO diagramming and vector drawing software extended with Sales Flowcharts solution from the Marketing area of ConceptDraw Solution Park offers the set of extensive tools for quick and easy drawing professional looking Sales Process Flowcharts.

How to Build a Flowchart

The ConceptDraw PRO is a professional software for quick creating great looking flowcharts. The vector stencils from object libraries allows you to use RapidDraw technology. By the clicking on direction arrows one can add new object to flowcharts. This technology gives to users the ability to fast creating visualization for the structural data.
Learn the basics of flowcharting and see how to build create a flowchart using ConceptDraw automatic drawing tools.
"Trade, also called goods exchange economy, is to transfer the ownership of goods from one person or entity to another by getting something in exchange from the buyer. Trade is sometimes loosely called commerce or financial transaction or barter. A network that allows trade is called a market. ...
Modern traders ... generally negotiate through a medium of exchange, such as money. As a result, buying can be separated from selling, or earning. ...
Retail trade consists of the sale of goods or merchandise from a very fixed location, such as a department store, boutique or kiosk, or by mail, in small or individual lots for direct consumption by the purchaser. Wholesale trade is defined as the sale of goods that are sold merchandise to retailers, to industrial, commercial, institutional, or other professional business users, or to other wholesalers and related subordinated services." [Trade. Wikipedia]
The deployment flow chart example "Trading process diagram" was created using the ConceptDraw PRO diagramming and vector drawing software extended with the Cross-Functional Flowcharts solution from the Business Processes area of ConceptDraw Solution Park.
Deployment flowchart
Deployment flowchart, process, horizontal swimlanes, decision,