 Venn Diagrams
Venn Diagrams are actively used to illustrate simple set relationships in set theory and probability theory, logic and statistics, mathematics and computer science, linguistics, sociology, and marketing. Venn Diagrams are also often used to visually summarize the status and future viability of a project.
 Circle-Spoke Diagrams
Examples of subject areas that are well suited to this approach are marketing, business, products promotion, process modeling, market, resource, time, and cost analysis. Circle-Spoke Diagrams are successfully used in presentations, conferences, management documents, magazines, reportages, reviews, reports, TV, and social media.
The vector stencils library "Venn diagrams" contains 12 templates of Venn and Euler diagrams.
Use these shapes to draw your Venn and Euler diagrams in the ConceptDraw PRO diagramming and vector drawing software extended with the Venn Diagrams solution from the area "What is a Diagram" of ConceptDraw Solution Park.
Use these shapes to draw your Venn and Euler diagrams in the ConceptDraw PRO diagramming and vector drawing software extended with the Venn Diagrams solution from the area "What is a Diagram" of ConceptDraw Solution Park.
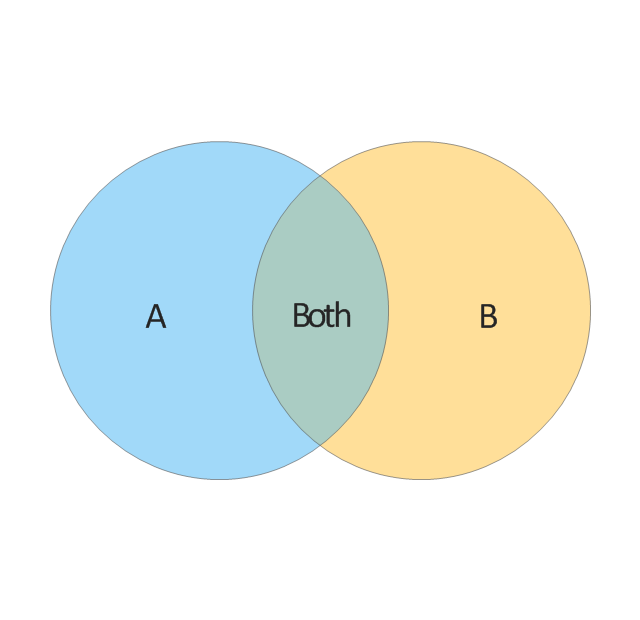
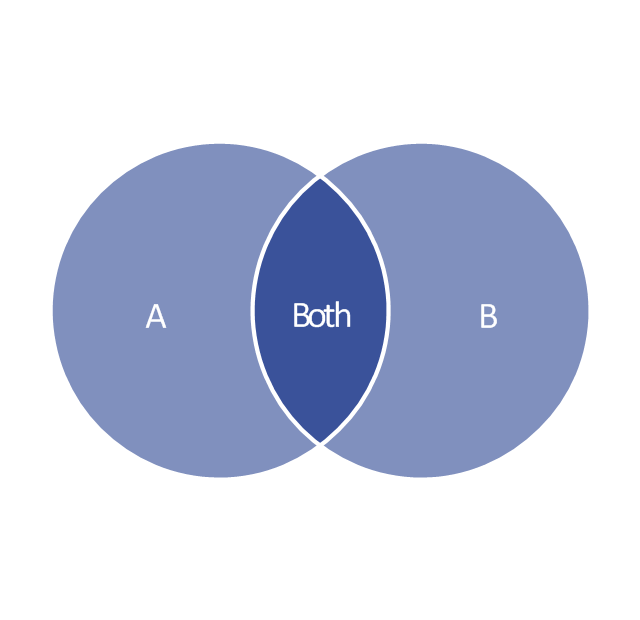
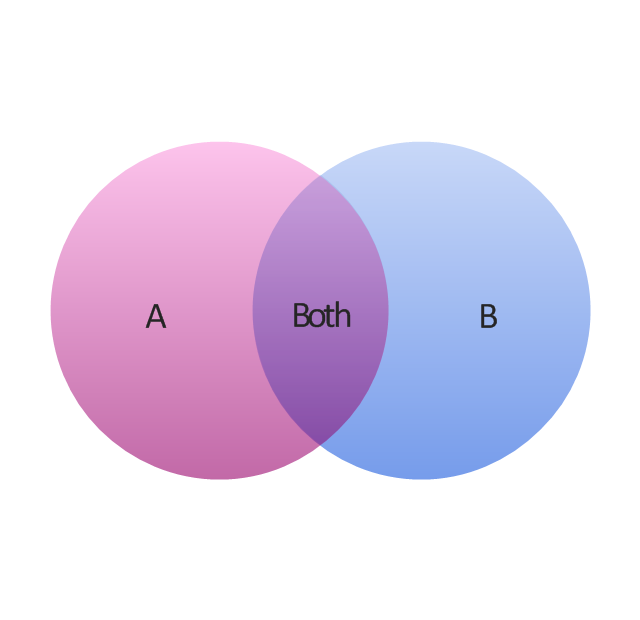
2-set Venn diagram
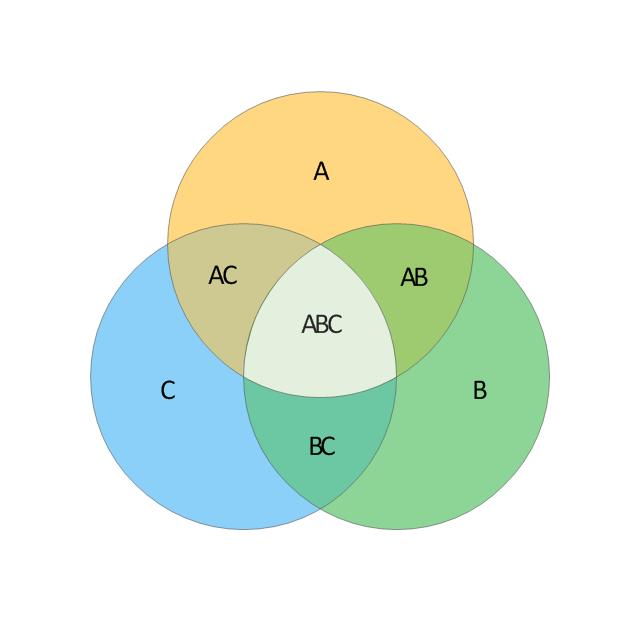
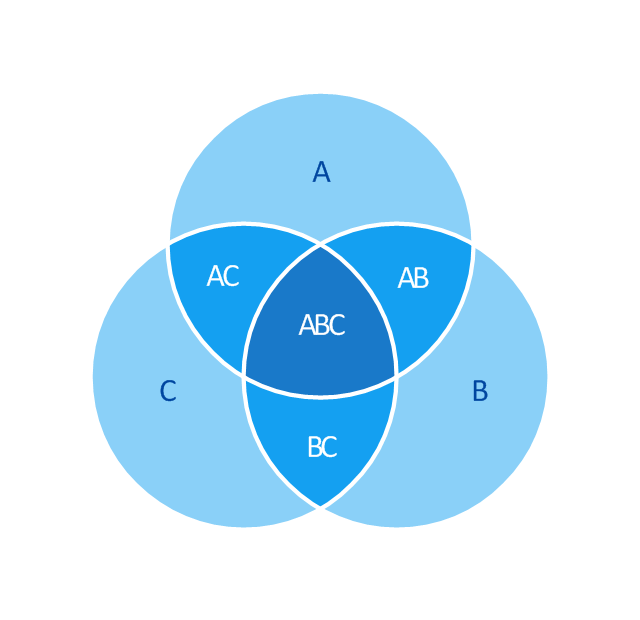
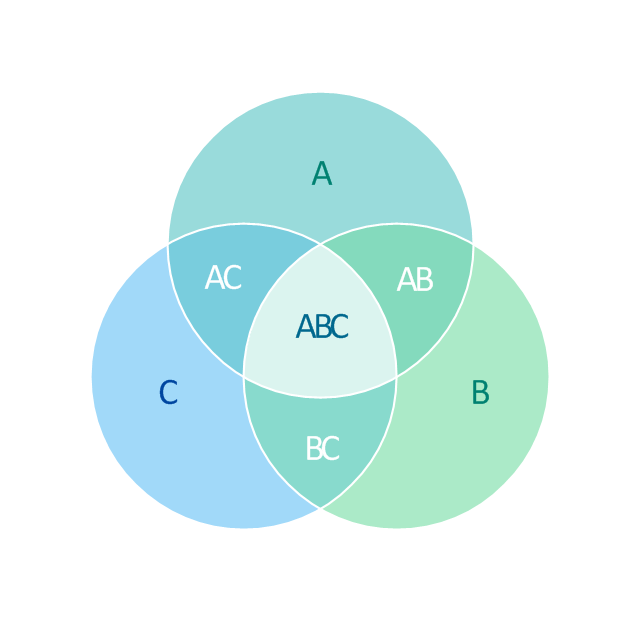
3-set Venn diagram
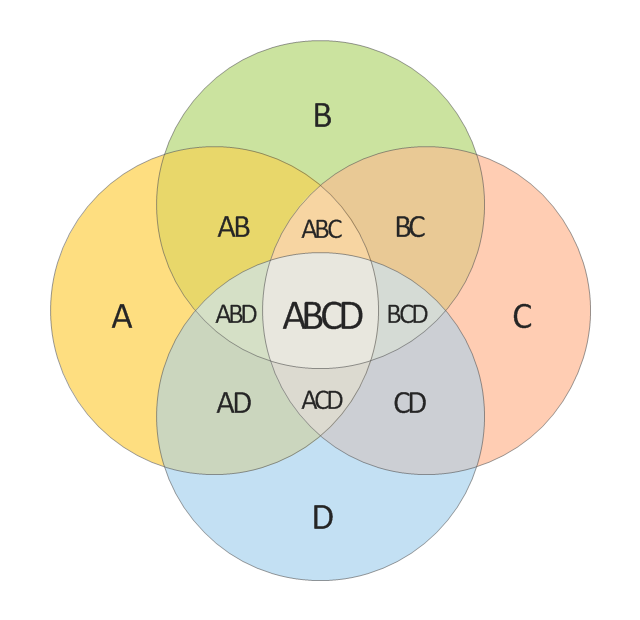
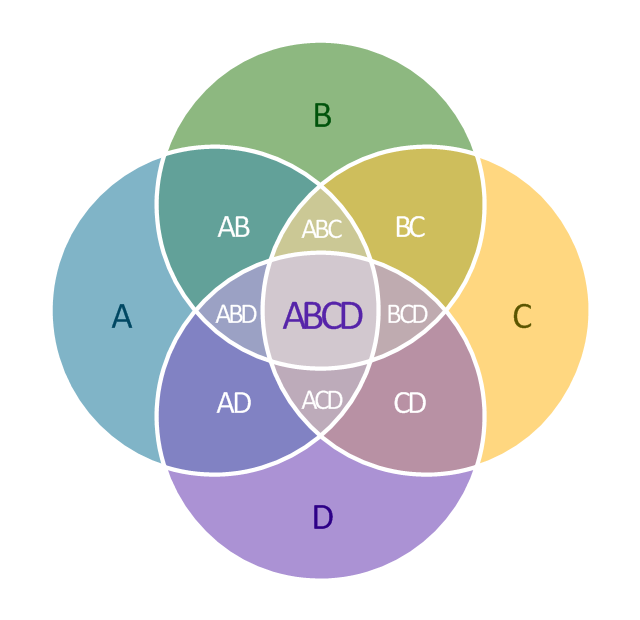
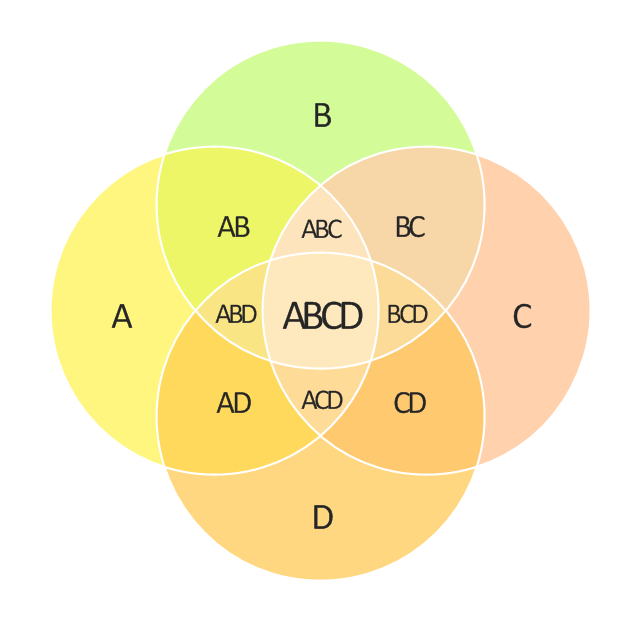
4-set Venn diagram
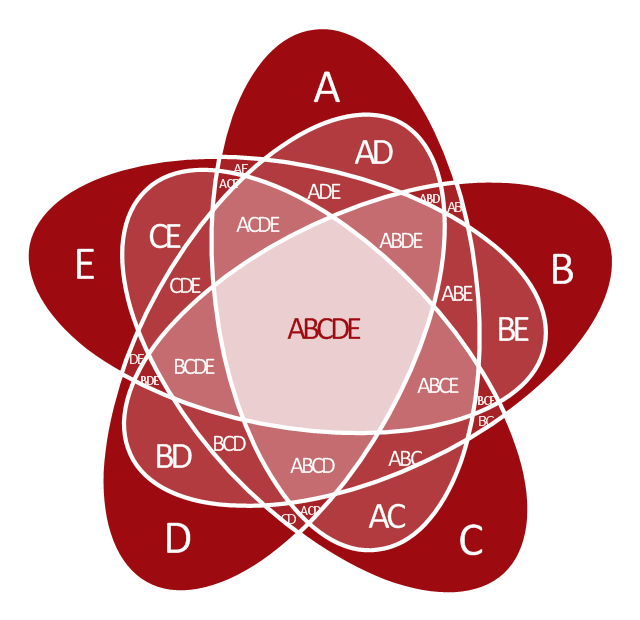
5-set Venn diagram

2-set Venn diagram
3-set Venn diagram
4-set Venn diagram
5-set Venn diagram
2-set Venn diagram
3-set Venn diagram
4-set Venn diagram
5-set Venn diagram

 Circular Arrows Diagrams
Circular Arrows Diagrams solution extends ConceptDraw PRO v10 with extensive drawing tools, predesigned samples, Circular flow diagram template for quick start, and a library of ready circular arrow vector stencils for drawing Circular Arrow Diagrams, Segmented Cycle Diagrams, and Circular Flow Diagrams. The elements in this solution help managers, analysts, business advisers, marketing experts, scientists, lecturers, and other knowledge workers in their daily work.
 Computer Network Diagrams
Computer Network Diagrams solution extends ConceptDraw PRO software with samples, templates and libraries of vector stencils for drawing the computer network topology diagrams.
 Target and Circular Diagrams
This solution extends ConceptDraw PRO software with samples, templates and library of design elements for drawing the Target and Circular Diagrams.
 Wireless Networks
The Wireless Networks Solution extends ConceptDraw PRO v10 software with professional diagramming tools to help network engineers and designers efficiently design and create wireless network diagrams that illustrate wireless networks of any speed and complexity.
 ConceptDraw Solution Park
ConceptDraw Solution Park collects graphic extensions, examples and learning materials
 Event-driven Process Chain Diagrams
Event-driven Process Chain (EPC) Diagram is a type of flowchart widely used for modeling in business engineering and reengineering, business process improvement, and analysis. EPC method was developed within the Architecture of Integrated Information Systems (ARIS) framework.
 Seating Plans
The correct and convenient arrangement of tables, chairs and other furniture in auditoriums, theaters, cinemas, banquet halls, restaurants, and many other premises and buildings which accommodate large quantity of people, has great value and in many cases requires drawing detailed plans. The Seating Plans Solution is specially developed for their easy construction.
 HVAC Plans
Use HVAC Plans solution to create professional, clear and vivid HVAC-systems design plans, which represent effectively your HVAC marketing plan ideas, develop plans for modern ventilation units, central air heaters, to display the refrigeration systems for automated buildings control, environmental control, and energy systems.
 Network Layout Floor Plans
Network Layout Floor Plan solution extends ConceptDraw PR software with samples, templates and libraries of vector stencils for drawing the computer network layout floor plans.
 Bubble Diagrams
Bubble diagrams have enjoyed great success in software engineering, architecture, economics, medicine, landscape design, scientific and educational process, for ideas organization during brainstorming, for making business illustrations, presentations, planning, design, and strategy development. They are popular because of their simplicity and their powerful visual communication attributes.
 Telecommunication Network Diagrams
Telecommunication Network Diagrams solution extends ConceptDraw PRO software with samples, templates and libraries of vector stencils for drawing the diagrams of telecommunication networks.
 Chemistry
This solution extends ConceptDraw PRO software with samples, template and libraries of vector stencils for drawing the Chemistry Illustrations for science and education.
Process Flow Chart Symbols

It is incredibly convenient to use the ConceptDraw PRO software extended with Flowcharts Solution from the "What is a Diagram" Area of ConceptDraw Solution Park for designing professional looking Process Flow Charts.
 Stakeholder Onion Diagrams
The Stakeholder Onion Diagram is often used as a way to view the relationships of stakeholders to a project goal. A basic Onion Diagram contains a rich information. It shows significance of stakeholders that will have has influence to the success achieve
 Business Process Diagrams
The Business Process Diagram Solution extends ConceptDraw PRO v10 BPMN software with its RapidDraw interface, templates, samples, and libraries based on the BPMN 1.2 and BPMN 2.0 standards. This powerful solution permits you to visualize easily both simple and complex processes, as well as design business models. The Business Process Diagram solution allows one to quickly develop and document in detail any business processes at any stage of a project’s planning and implementation.
 Language Learning
Language Learning solution extends ConceptDraw PRO software with templates, samples and library of vector stencils for drawing the sentence diagrams.
- Venn Diagrams | 5 -Set Venn diagram - Template | Venn Diagram ...
- 3 Circle Venn Diagram Template
- Circles Venn Diagram | 4-Set Venn diagram - Template | Circular ...
- 3 Circle Venn Diagram . Venn Diagram Example
- 5 -Set Venn diagram - Template | Multi Layer Venn Diagram . Venn ...
- 3 Circle Venn Diagram . Venn Diagram Example | Circular diagrams ...
- 2 Circle Venn Diagram Template
- Circles Venn Diagram
- Circle Spoke Diagram Template | Circle Diagrams | 2 Circle Venn ...
- Venn Diagram Maker | Venn Diagram Template for Word | 4-Set ...
- Circle Spoke Diagram Template | 3 Circle Venn Diagram . Venn ...
- 2 Circle Venn Diagram . Venn Diagram Example | Venn Diagrams ...
- Venn diagrams - Vector stencils library | 3 Circle Venn. Venn ...
- 2-Set Venn diagram template | Venn diagrams - Vector stencils ...
- Circle -Spoke Diagrams | How to Draw a Circle -Spoke Diagram in ...
- Venn diagrams with ConceptDraw PRO | Basic Circles Venn ...
- Venn Diagram | 5 -Set Venn diagram - Template | 4-Set Venn ...
- How to Draw a Flowchart | 5 Arrow Circle Vector Png
- Circle Spoke Diagram Template | 2 Circle Venn Diagram . Venn ...
- Venn Diagram Maker To Draw Venn Diagrams