Horizontal Flowchart

Horizontal Orgchart

Horizontal Org Flow Chart

Horizontal Cross Functional Flowchart

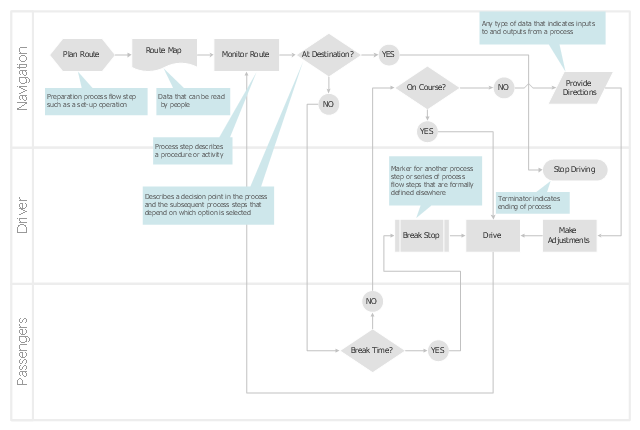
Cross-Functional (Deployment) Flowcharts visualize what functional units (people, departments or functional areas) are responsible for the business process operations. The flowcharts are divided into rows/ columns of functional units. Blocks of various shapes represent the process steps, and are placed in rows/ columns of the responsible functional units. These flowcharts are used to display the relationships of processes and responsible functional units.
The cross-functional horizontal flowchart template for the ConceptDraw PRO diagramming and vector drawing software is included in the Cross-Functional Flowcharts solution from the Business Processes area of ConceptDraw Solution Park.
The cross-functional horizontal flowchart template for the ConceptDraw PRO diagramming and vector drawing software is included in the Cross-Functional Flowcharts solution from the Business Processes area of ConceptDraw Solution Park.
Cross-functional flowchart template
"American football (known as football in the United States and gridiron in some other countries) is a sport played by two teams of eleven players on a rectangular field 120 yards long by 53.33 yards wide with goalposts at each end. The offense attempts to advance an oval ball (the football) down the field by running with or passing it. They must advance it at least ten yards in four downs to receive a new set of four downs and continue the drive; if not, they turn over the football to the opposing team. Most points are scored by advancing the ball into the opposing team's end zone for a touchdown or kicking the ball through the opponent's goalposts for a field goal. The team with the most points at the end of a game wins." [American football. Wikipedia]
The diagram example "Horizontal football field" was created using the ConceptDraw PRO diagramming and vector drawing software extended with the Football solution from the Sport area of ConceptDraw Solution Park.
The diagram example "Horizontal football field" was created using the ConceptDraw PRO diagramming and vector drawing software extended with the Football solution from the Sport area of ConceptDraw Solution Park.
American football field diagram
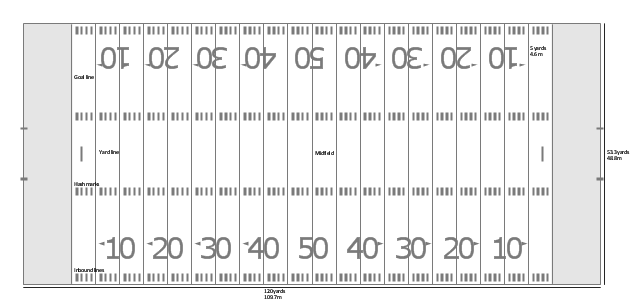
"Football games are played on a rectangular field that measures 120 yards (110 m) long and 53.33 yards (48.76 m) wide. Lines marked along the ends and sides of the field are known respectively as the end lines and side lines, and goal lines are marked 9 yards (8.2 m) outward from each end line. Weighted pylons are placed on the inside corner of the intersections of the goal lines and end lines.
White markings on the field identify the distance from the end zone. Inbound lines, or hash marks, are short parallel lines that mark off 1 yard (0.91 m) increments. Yard lines, which run the width of the field, are marked every 5 yards (4.6 m). A line one yard wide is placed at each end of the field. This line is marked at the center of the two-yard line in professional play and at the three-yard line in college play. Numerals that display the yard lines in multiples of ten are placed along both sides of the field.
Goalposts are at the center of the plane of each of the two end lines. The crossbar of these posts is ten feet (3 meters) above the ground, with vertical uprights at the end of the crossbar 18 feet 6 inches (6 m) apart for professional and collegiate play and 23 feet 4 inches (7 m) apart for high school play. The uprights extend vertically 10 yards on professional fields, a minimum of 10 yards on college fields, and a minimum of ten feet on high school fields. Goal posts are padded at the base, and orange ribbons are normally placed at the tip of each upright." [American football. Wikipedia]
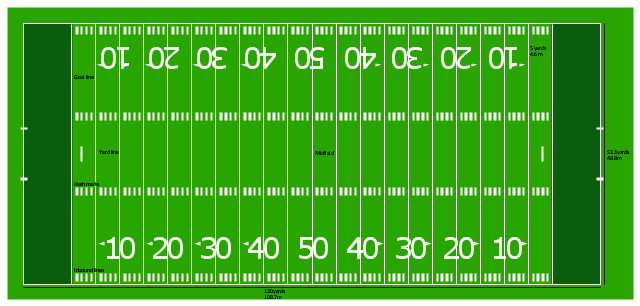
The diagram example "Horizontal colored football field" was created using the ConceptDraw PRO diagramming and vector drawing software extended with the Football solution from the Sport area of ConceptDraw Solution Park.
White markings on the field identify the distance from the end zone. Inbound lines, or hash marks, are short parallel lines that mark off 1 yard (0.91 m) increments. Yard lines, which run the width of the field, are marked every 5 yards (4.6 m). A line one yard wide is placed at each end of the field. This line is marked at the center of the two-yard line in professional play and at the three-yard line in college play. Numerals that display the yard lines in multiples of ten are placed along both sides of the field.
Goalposts are at the center of the plane of each of the two end lines. The crossbar of these posts is ten feet (3 meters) above the ground, with vertical uprights at the end of the crossbar 18 feet 6 inches (6 m) apart for professional and collegiate play and 23 feet 4 inches (7 m) apart for high school play. The uprights extend vertically 10 yards on professional fields, a minimum of 10 yards on college fields, and a minimum of ten feet on high school fields. Goal posts are padded at the base, and orange ribbons are normally placed at the tip of each upright." [American football. Wikipedia]
The diagram example "Horizontal colored football field" was created using the ConceptDraw PRO diagramming and vector drawing software extended with the Football solution from the Sport area of ConceptDraw Solution Park.
American football field diagram
"For text input, the iPhone implements a virtual keyboard on the touchscreen. It has automatic spell checking and correction, predictive word capabilities, and a dynamic dictionary that learns new words. The keyboard can predict what word the user is typing and complete it, and correct for the accidental pressing of keys near the presumed desired key.
The keys are somewhat larger and spaced farther apart when in landscape mode, which is supported by only a limited number of applications. Touching a section of text for a brief time brings up a magnifying glass, allowing users to place the cursor in the middle of existing text. The virtual keyboard can accommodate 21 languages, including character recognition for Chinese.
Alternate characters with accents (for example, letters from the alphabets of other languages) can be typed from the keyboard by pressing the letter for 2 seconds and selecting the alternate character from the popup. The 3.0 update brought support for cut, copy, or pasting text, as well as landscape keyboards in more applications." [iPhone. Wikipedia]
The example "iPhone OS (iOS) graphic user interface (GUI) - Horizontal mode" was created using the ConceptDraw PRO diagramming and vector drawing software extended with the Graphic User Interface solution from the Software Development area of ConceptDraw Solution Park.
iPhone GUI
-graphic-user-interface-(gui)---horizontal-mode.png--diagram-flowchart-example.png)
Cross-Functional Flowchart


The vector stencils library "Composition indicators" contains 6 dashboard graphic indicators: 2 horizontal divided bars, 2 vertical divided bars, and 2 mini pie charts.
Composition Indicators are Live Objects which show the percentage of two parts of one total.
Composition Indicators useful for:
• comparison of one part with the total
• comparison of two parts of one total.
Use this library for drawing visual dashboards in the ConceptDraw PRO diagramming and vector drawing software extended with the Composition Dashboard solution from the area "What is a Dashboard" of ConceptDraw Solution Park.
www.conceptdraw.com/ solution-park/ composition-dashboard
Horizontal Divided Bar Indicator 1

Mini Pie Chart Indicator 1

Vertical Divided Bar Indicator 1

Horizontal Divided Bar Indicator 2

Vertical Divided Bar Indicator 2

Mini Pie Chart Indicator 2

How to Create a Bar Chart

Bar Chart Software

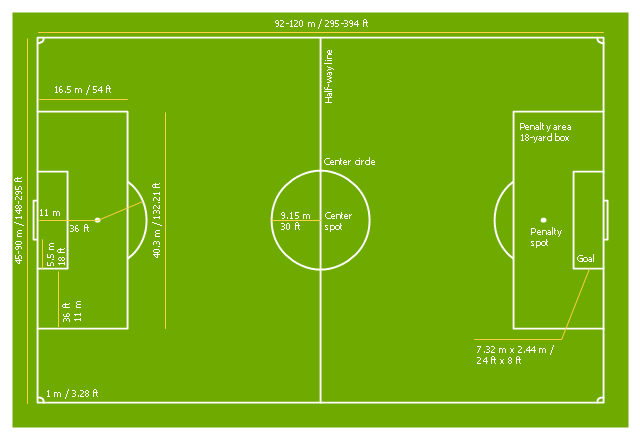
"A football pitch (also known as a football field or soccer field) is the playing surface for the game of football made of turf. Its dimensions and markings are defined by Law 1 of the Laws of the Game, "The Field of Play".
All line markings on the pitch form part of the area which they define. For example, a ball on or above the touchline is still on the field of play; a ball on the line of the goal area is in the goal area; and a foul committed over the 16.5-metre (18-yard) line has occurred in the penalty area. Therefore a ball must completely cross the touchline to be out of play, and a ball must wholly cross the goal line (between the goal posts) before a goal is scored; if any part of the ball is still on or above the line, the ball is still in play.
The field descriptions that apply to adult matches are described below. Note that due to the original formulation of the Laws in England and the early supremacy of the four British football associations within IFAB, the standard dimensions of a football pitch were originally expressed in imperial units. The Laws now express dimensions with approximate metric equivalents (followed by traditional units in brackets), but use of the imperial units remains common in some countries, especially in the United Kingdom." [Association football pitch. Wikipedia]
The template "Horizontal colored association football pitch" for the ConceptDraw PRO diagramming and vector drawing software is included in the Soccer solution from the Sport area of ConceptDraw Solution Park.
www.conceptdraw.com/ solution-park/ sport-soccer
Soccer field template
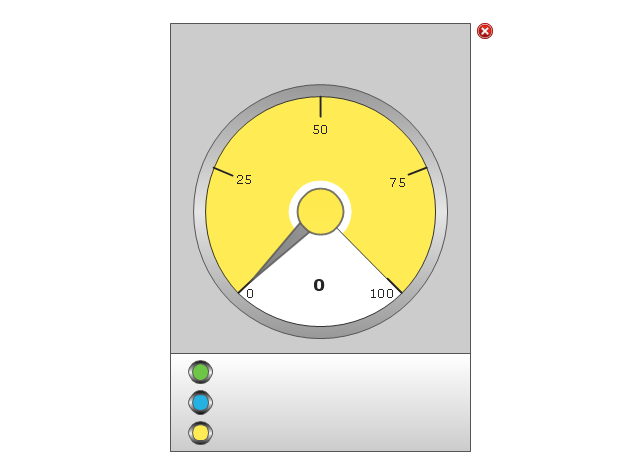
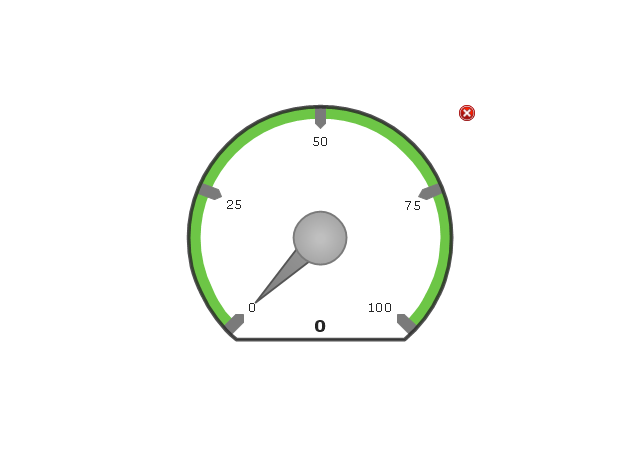
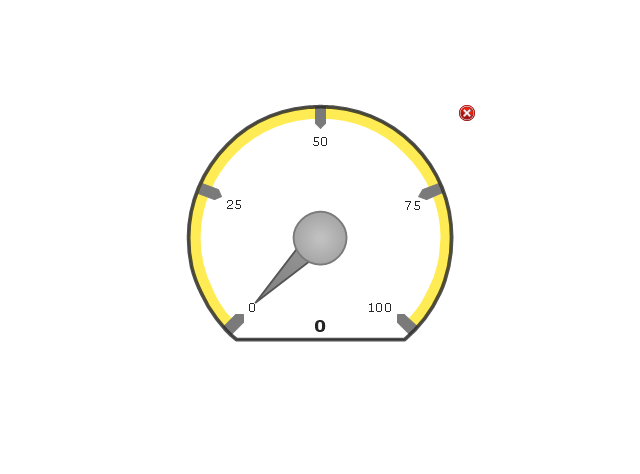
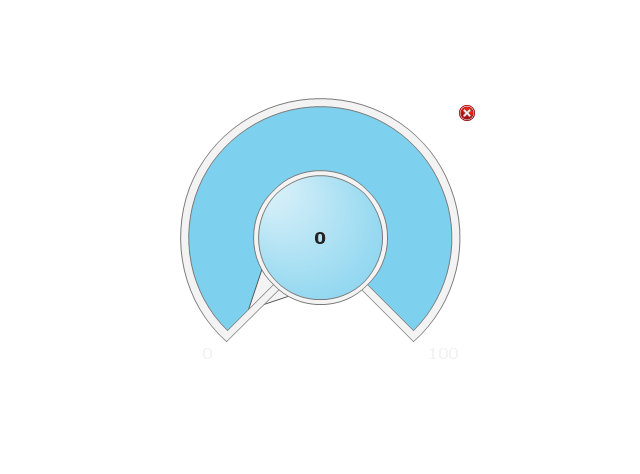
The vector stencils library "Meter indicators 2" (for dark background) contains 29 Live Objects: speedometer gauge, dial, bullet, slider and level meter visual indicators.
The Live Objects designed to display actual measures of performance metrics from external data source files. Some of them also display comparative measures, and colored zones of qualitative ranges with legend.
Use this library to create visual dashboards in the ConceptDraw PRO diagramming and vector drawing software extended with the Meter Dashboard solution from the area "What is a Dashboard" of ConceptDraw Solution Park.
Speedometer Gauge 1

Speedometer Gauge 2
Speedometer Gauge 3
Speedometer Gauge 4
Dial 1
Dial 2
Bullet 1

Bullet 2
Bullet 3
Bullet 4

Bullet 5

Bullet 6

Directed Bullet 1
Directed Bullet 2

Slider Horizontal 1
Slider Horizontal 2
Slider Horizontal 3
Slider Horizontal 4
Slider Vertical 1
Slider Vertical 2
Slider Horizontal 5
Slider Horizontal 6
Slider Horizontal 7
Slider Vertical 3
Level Meter 1
Level Meter 2
Level Meter 3
Level Meter 4
Level Meter 5
The vector stencils library "Sales dashboard" contains 27 charts and graphic indicators.
Use it for drawing sales dashboards in the ConceptDraw PRO diagramming and vector drawing software extended with the Sales Dashboard solution from the Marketing area of ConceptDraw Solution Park.
Use it for drawing sales dashboards in the ConceptDraw PRO diagramming and vector drawing software extended with the Sales Dashboard solution from the Marketing area of ConceptDraw Solution Park.
Column Chart

Bar Chart

Line Chart

Divided Bar

Pie Chart

Two Bubbles Indicator

Speedometer Gauge 1

Speedometer Gauge 2

Speedometer Gauge 3

Speedometer Gauge 4

Slider Horizontal 1

Slider Horizontal 2

Slider Horizontal 3

Slider Horizontal 4

Slider Horizontal 5

Slider Horizontal 6

Slider Horizontal 7

Slider Vertical 1

Slider Vertical 2

Slider Vertical 3

Bullet 1

Bullet 2

Bullet 3

Bullet 4

Backgroung 1

Backgroung 2

Backgroung 3

- Horizontal Flowchart | Horizontal Org Flow Chart | Cross-functional ...
- Horizontal Org Flow Chart | Horizontal Orgchart | Organizational ...
- Horizontal Org Flow Chart | Horizontal Orgchart | Organizational ...
- Horizontal Orgchart | Organization Chart Templates | Horizontal Org ...
- Horizontal Flowchart | Horizontal Org Flow Chart | Cross-Functional ...
- Horizontal Cross Functional Flowchart
- Horizontal Flowchart | Horizontal Org Flow Chart | Process Flowchart ...
- Cross Functional Horizontal Diagram
- Cross-Functional Flowchart | Horizontal Flowchart | Process ...
- Cross Functional Horizontal
- Horizontal Orgchart | 25 Typical Orgcharts | Organization Chart ...
- Horizontal Flowchart | Cross-Functional Flowchart | Basic Flowchart ...
- Bar Chart Software | Bar Graphs | Bar Chart Examples | Horizontal ...
- Horizontal Process Funnel Powerpoint Template
- Horizontal Org Flow Chart | Horizontal Orgchart | Create ...
- Horizontal Flowchart
- Draw A Diagram Of A Horizontal Vertical Lateral And Rotary Method ...
- Rectangle With Horizontal Lines On Two Side Is Used Fir Flow Chart
- Cross-Functional Flowchart | Cross-functional horizontal flowchart ...