Relationships Analysis


Healthy Food Ideas
CORRECTIVE ACTIONS PLANNING. Risk Diagram (PDPC)

Create Sophisticated Professional Diagrams - Simply

Design Pictorial Infographics. Design Infographics

Healthy Diet Plan
Healthy Meal Recipes
Healthy Food Recipes
Healthy Diet
Flowchart Examples and Templates

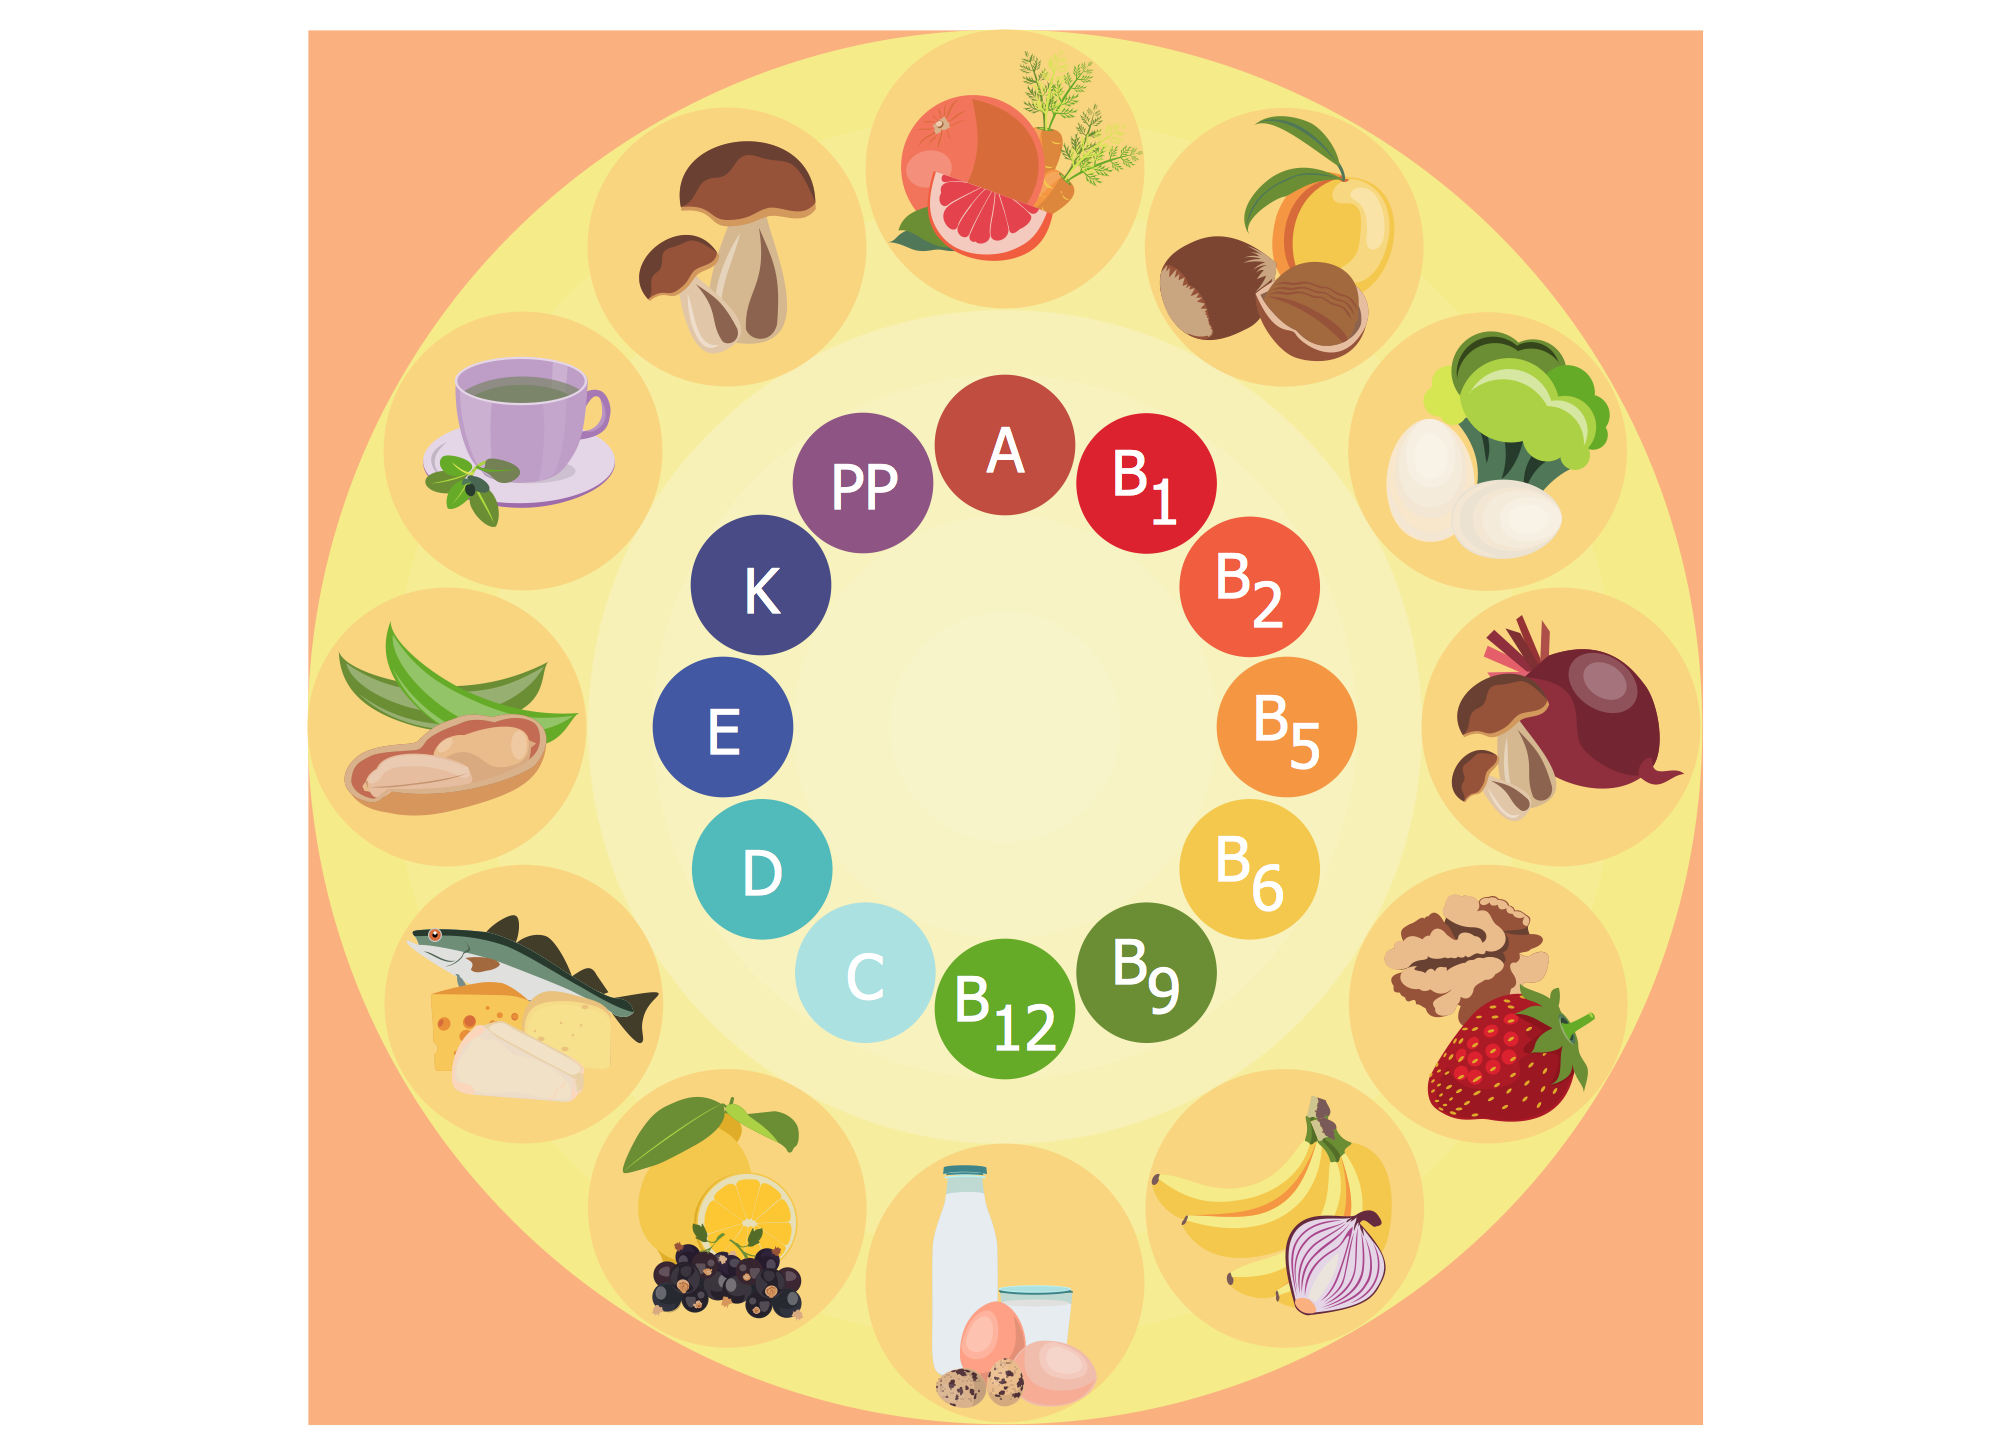
Healthy Foods

HelpDesk
How to Create Infographics that Help People Eat Healthy

Circle Diagrams

"Interrelationship Digraph (ID).
This tool displays all the interrelated cause-and-effect relationships and factors involved in a complex problem and describes desired outcomes. The process of creating an interrelationship digraph helps a group analyze the natural links between different aspects of a complex situation." [Seven Management and Planning Tools. Wikipedia]
"Causality (also referred to as causation) is the relation between an event (the cause) and a second event (the effect), where the second event is understood as a consequence of the first.
In common usage, causality is also the relation between a set of factors (causes) and a phenomenon (the effect). Anything that affects an effect is a factor of that effect. A direct factor is a factor that affects an effect directly, that is, without any intervening factors. (Intervening factors are sometimes called "intermediate factors".) The connection between a cause(s) and an effect in this way can also be referred to as a causal nexus.
Though the causes and effects are typically related to changes or events, candidates include objects, processes, properties, variables, facts, and states of affairs; characterizing the causal relation can be the subject of much debate." [Causality. Wikipedia]
The relations diagram example "Health care" was created using the ConceptDraw PRO diagramming and vector drawing software extended with the solution "Seven Management and Planning Tools" from the Management area of ConceptDraw Solution Park.
Relations diagram

- Diagram And Flowchart Related To Nutritional Diet
- Fishbone diagram - HAN project | Relations diagram - Health care ...
- Circle-Spoke Diagrams | Social Determinants Of Health Infographic
- Diagrams On Health
- Health Food | Social determinants of health | Health endpoint ...
- Healthy Foods | Health Food | Healthy Meal Recipes | Nutrition ...
- NIH components | Basic Circle-Spoke Diagrams | Biomedical ...
- Interrelationship Of Health And Development Diagram
- Problem Analysis Diagram In Health System Management
- How To Have A Healthy Lifestyle In A Flowchart Diagram
- Create Sophisticated Professional Diagrams - Simply | How to ...
- Healthy Food Ideas | Food security assessment - Flowchart | Top 5 ...
- Diagrams Of Healthy Food
- Fishbone Diagrams | Fishbone Diagram | Health Food | Fish Rack ...
- Fishbone Diagram | Health Food | Fishbone Diagrams | Fishbone ...
- Circle-Spoke Diagrams | Circle Diagrams | Venn Diagram ...
- Social Ecological Model (SEM) - Onion diagram | Social ...
- Fishbone diagram - HAN project | Fishbone Diagram | Fishbone ...
- Fishbone Diagram Health Problem