CORRECTIVE ACTIONS PLANNING. Risk Diagram (PDPC)
Risk Diagram (PDPC) - ConceptDraw Office suite is a software for Risks Diagram making. This diagram identifies possible risks in accomplishing corrective actions. With the Risks Diagram, one analyzes each action separately in a tree of all actions and develops a preventive action in response of each potential obstacles or circumstances which may be a risk.
Relationships Analysis
Relationships Analysis. Relations Diagram - factors analysis, factors relations. Create Relations Diagram with ConceptDraw PRO. The Seven Management and Planning Tools is a tool for Interaction diagram drawing. This diagram identifies causal relationships. Determine what factors are causes and which factors are effects. Interaction diagram helps establish KPIs to monitor changes and the effectiveness of corrective actions in resolving the problem.
Healthy Foods
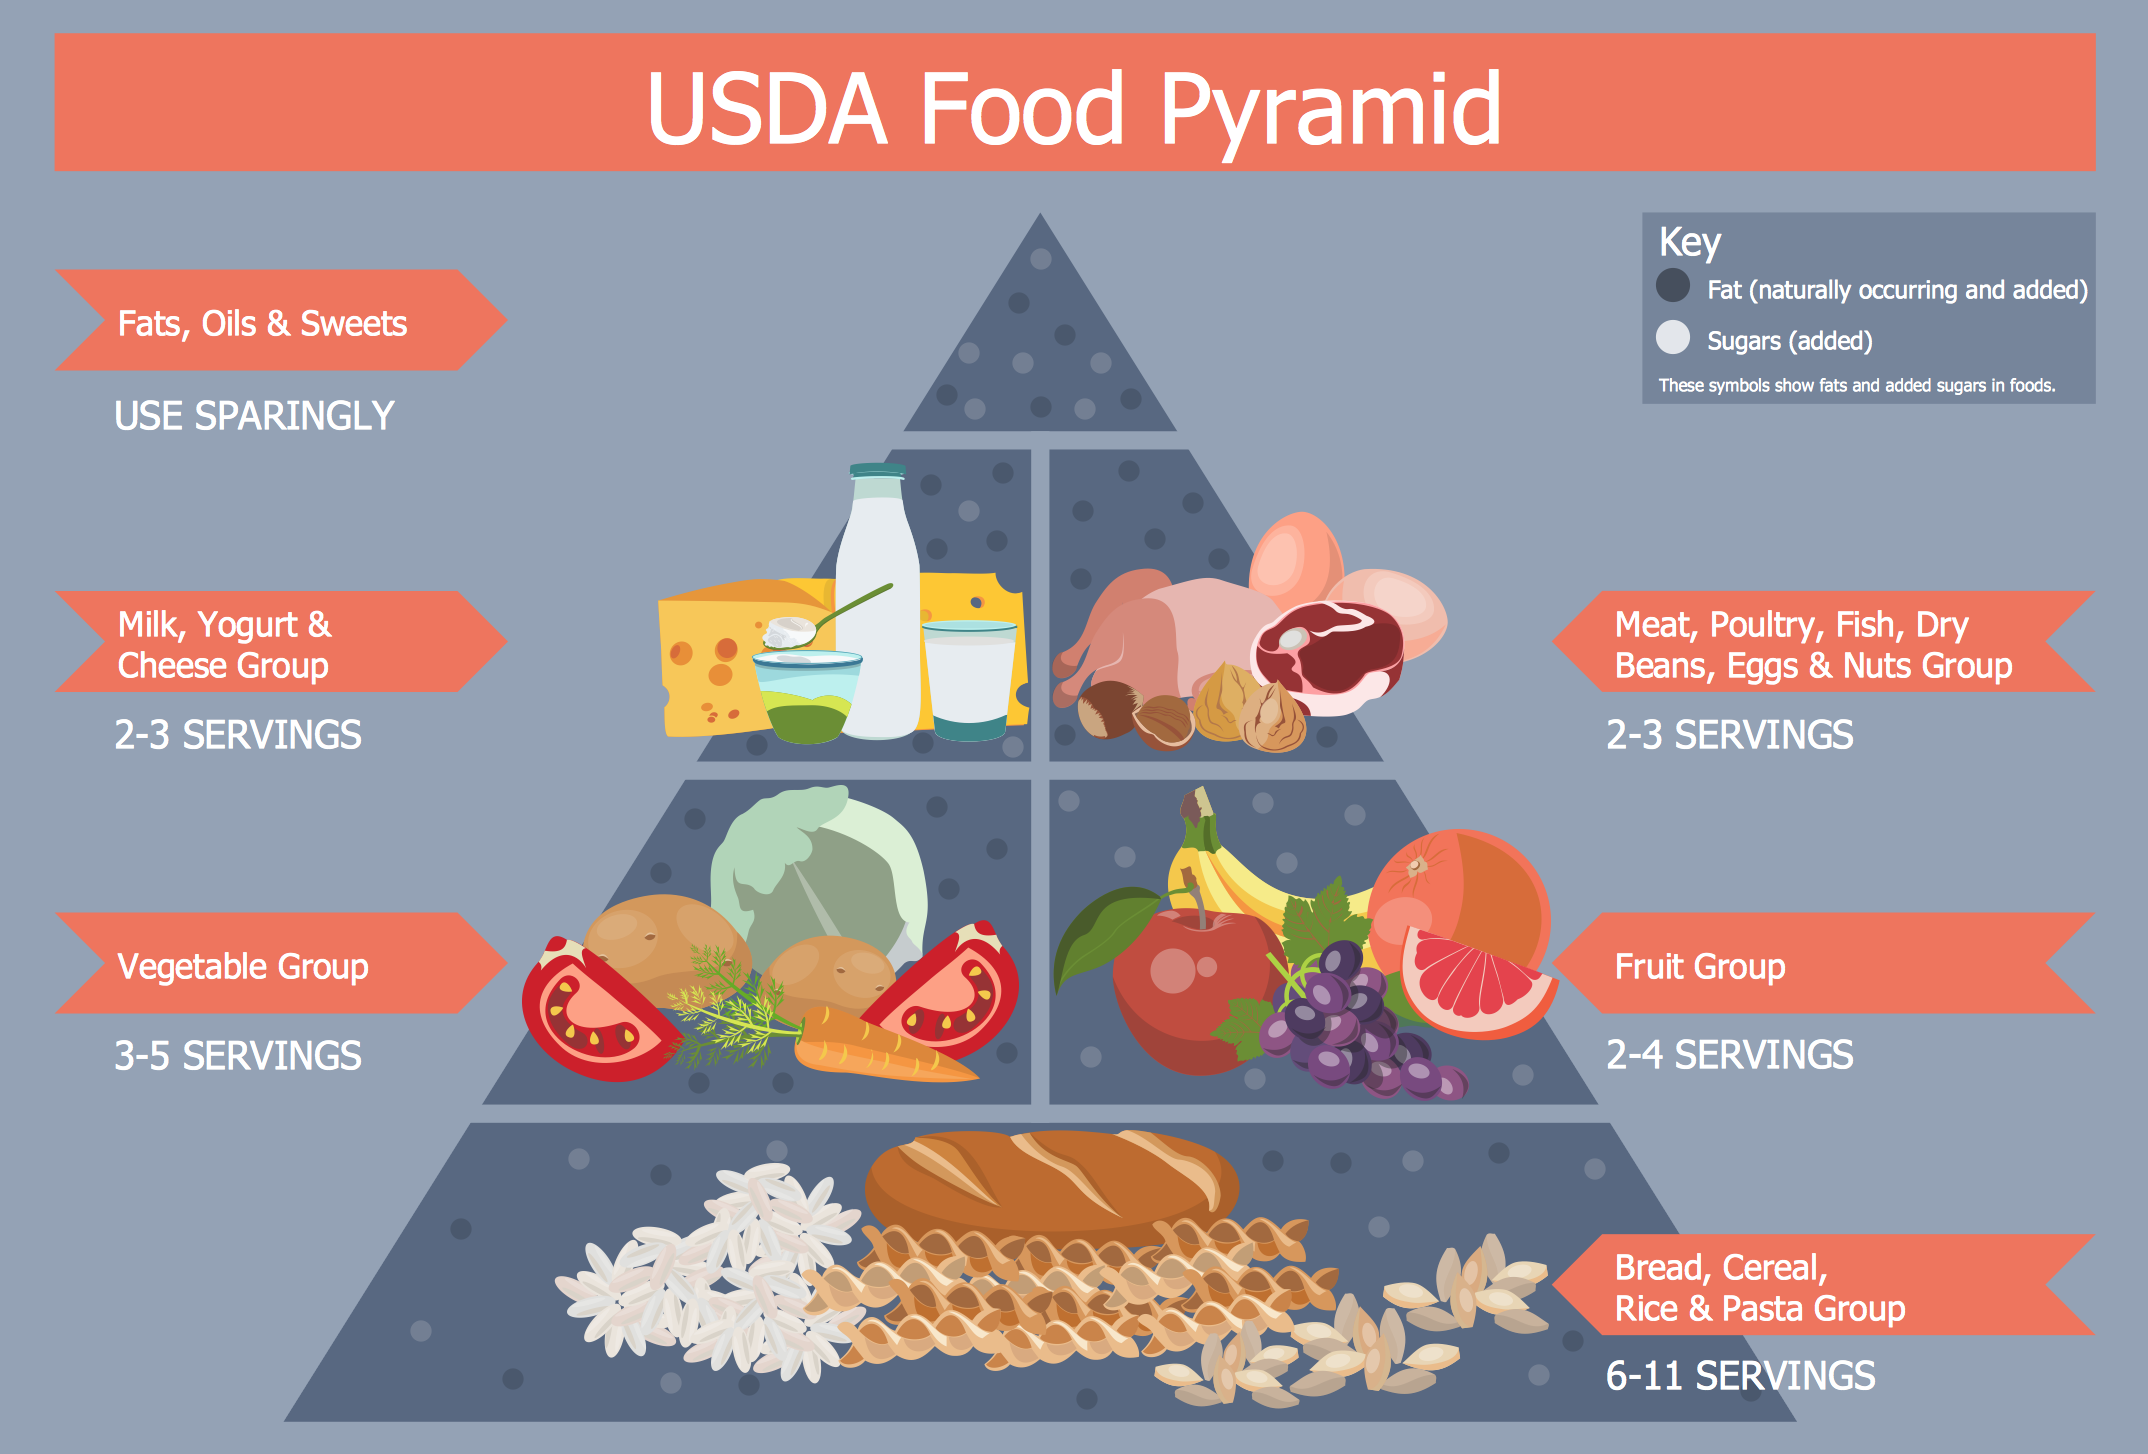
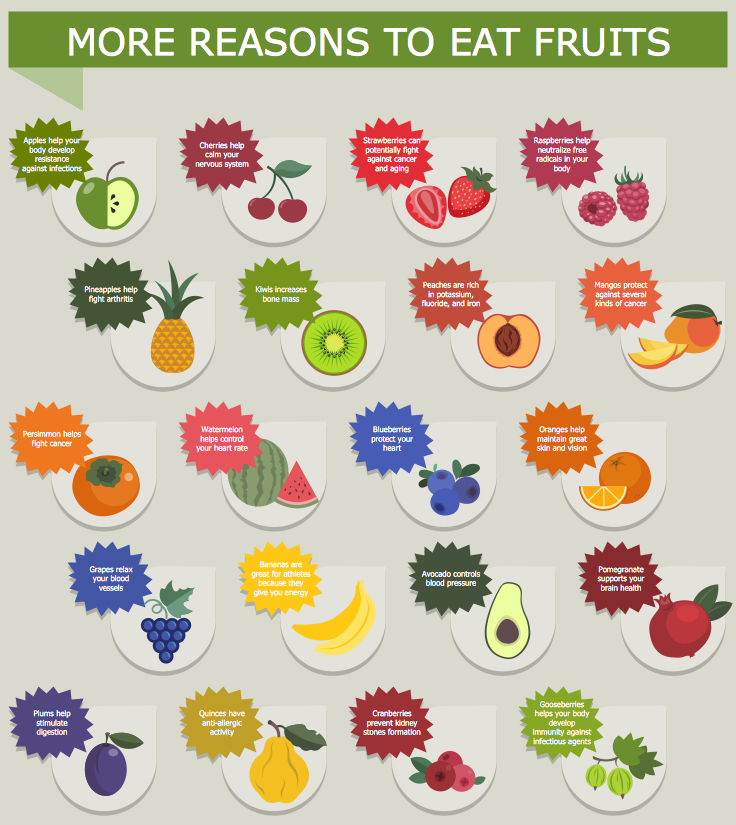
Use of various charts, diagrams and infographics is the most effective way of visual presenting information about healthy foods, healthy eating and healthy diet. ConceptDraw PRO diagramming and vector drawing software offers the Health Food solution from the Food and Beverage area of ConceptDraw Solution Park which is overfull of powerful drawing tools, libraries with ready-to-use vector objects and clipart, predesigned samples and examples which will help you easy design healthy foods illustrations.Healthy Diet Plan
The human organism is so constituted that for a full life you need a wide range of nutrients, minerals and vitamins. To get all this, it is necessary to enrich your nutrition by natural and healthy food. The same microelements and nutrients are contained in different foods, so it is very important to create your own healthy diet plan, based on your preferences and containing the balance of nutrients suitable for you. ConceptDraw PRO diagramming and vector drawing software extended with Health Food solution from the Food and Beverage area of ConceptDraw Solution Park contains powerful tools for designing healthy diet plan.Design Pictorial Infographics. Design Infographics
In the course of recent decades data visualization went through significant development and has become an indispensable tool of journalism, business intelligence and science. The way visual information may be conveyed is not limited simply to static or dynamic representation, it can also be interactive. Infographics can be conditionally divided into several general levels. Primarily, this is level of visualization of information, its interpretation and association on any ground. Second level can be defined as a visualization of knowledge, depiction of thoughts and ideas in the form of images or diagrams. Finally, the level of data visualization, which processes data arrays in charts, enabling the information to be more clearly perceived. You can also identify the main approaches to the creation of infographics: exploratory and narrative. Exploratory method insists on minimalist design in favor of data precision without unnecessary details and is common for scientific researches and anaCORRECTIVE ACTIONS PLANNING. PERT Chart
The PERT Chart is constructed as part of the process in creating a schedule of corrective actions. The PERT Chart shows the logical connections and consequence of tasks to be performed. It displays the time period for problem solving and the implementation of all activities through the critical path. ConceptDraw Office suite is a software for corrective actions planning.
Food Pictures
One of the key roles at the attracting visitors in catering establishments of different formats plays their visual solution, design of advertising elements of fast foods and restaurants. ConceptDraw PRO software enhanced with unique Food Court solution from the Food and Beverage area of ConceptDraw Solution Park allows to design inviting and attractive signboards, pictorial menus with appetizing food pictures.Types of Flowcharts
A Flowchart is a graphical representation of process, algorithm, workflow or step-by-step solution of the problem. It shows the steps as boxes of various kinds and connects them by arrows in a defined order depicting a flow. There are twelve main Flowchart types: Basic Flowchart, Business Process Modeling Diagram (BPMN), Cross Functional Flowchart, Data Flow Diagram (DFD), IDEF (Integrated DEFinition) Flowchart, Event-driven Process Chain (EPC) Diagram, Influence Diagram (ID), Swimlane Flowchart, Process Flow Diagram (PFD), Specification and Description Language (SDL) Diagram, Value Stream Mapping, Workflow Diagram. Using the Flowcharts solution from the Diagrams area of ConceptDraw Solution Park you can easy and quickly design a Flowchart of any of these types. This solution offers a lot of special predesigned vector symbols for each of these widely used notations. They will make the drawing process of Flowcharts much easier than ever. Pay also attention for the included collection of ready Flowchart examples, samples and quick-start templates. This is business process improvement tools. If you are looking for MS Visio for your Mac, then you are out of luck, because it hasn't been released yet. However, you can use Visio alternatives that can successfully replace its functions. ConceptDraw PRO is an alternative to MS Visio for Mac that provides powerful features and intuitive user interface for the same.
TQM Diagram — Professional Total Quality Management
The Total Quality Management Diagram solution helps you and your organization visualize business and industrial processes. Create Total Quality Management diagrams for business process with ConceptDraw software.
 Picture Graphs
Typically, a Picture Graph has very broad usage. They many times used successfully in marketing, management, and manufacturing. The Picture Graphs Solution extends the capabilities of ConceptDraw PRO v10 with templates, samples, and a library of professionally developed vector stencils for designing Picture Graphs.
How to Draw Pictorial Chart. How to Use Infograms
How to draw pictorial chart quick, easy and effective? ConceptDraw PRO offers the unique Pictorial Infographics Solution that will help you! Pictorial Infographics solution contains large number of libraries with variety of predesigned vector pictograms that allows you design infographics in minutes. There are available 10 libraries with 197 vector pictograms.Food Images
You need design pictorial food images to decorate menu of your restaurant or to create beautiful advertising materials? We recommend to use a ConceptDraw PRO diagramming and vector drawing software extended with Food Court solution from the Food and Beverage area of ConceptDraw Solution Park for easy designing colorful food images.The Action Plan
Action Plan - For the action planning define people and groups involvement in corrective actions by roles, identify logical sequences of scheduled actions and critical path of problem solving, identify possible risks of action plan and propose preventive actions. ConceptDraw Office suite is a software for decision making and action plan.
Pie Chart Word Template. Pie Chart Examples
The Pie Chart visualizes the data as the proportional parts of a whole and looks like a disk divided into sectors. The pie chart is type of graph, pie chart looks as circle devided into sectors. Pie Charts are widely used in the business, statistics, analytics, mass media. It’s very effective way of displaying relative sizes of parts, the proportion of the whole thing.- Healthy Diet Plan | Healthy Diet | Food Pictures | Image Of Balance ...
- Healthy Foods | Drawing Images Of Chart Of Balanced Diet
- Images For Balance Diet Chart Project
- Healthy Diet Plan | Healthy Diet | Food Pictures | Balanced Diet ...
- Food Pictures | Healthy Diet Plan | Pictures of Food | Picture Diet Chart
- Healthy Diet Plan | Food Pictures | Healthy Meal Recipes | Picture ...
- Healthy Diet Plan | Food Pictures | Healthy Diet | Healthy Diet Chart ...
- Health Food Pic For Making Chart
- Healthy Diet Plan | Food Pictures | Pictures of Food | Diet Chart With ...
- Food Pictures | Healthy Diet Plan | Food Images | Patient Diet With ...
- Healthy Food Picture Chart
- Healthy Diet Plan | Food Pictures | Healthy Meal Recipes | Image To ...
- Balance Diet Chart Images For Project
- Healthy Food Ideas | Healthy Foods | Food Court | Flow Chart ...
- Healthy Foods | Healthy Diet Plan | Health Food | Health Circle Images
- Healthy Diet Plan | Healthy Food Recipes | Healthy Food Ideas ...
- Fruit Chart Image To Draw
- Healthy Foods | Pictures of Food | Pictures of Vegetables | Draw A ...
- Healthy Diet Plan | Healthy Foods | Healthy Food Ideas | Draw A ...
- Fruit Art | Food Court | Health Food | Fruit Chart With Design Elements


