Simple Diagramming


Pie Chart Examples and Templates

Examples of Flowcharts, Org Charts and More


 Basic Diagramming
This solution extends ConceptDraw DIAGRAM software with the specific tools you need to easily draw flowcharts, block diagrams, histograms, pie charts, divided bar diagrams, line graphs, circular arrows diagrams, Venn diagrams, bubble diagrams and concept maps
 Target and Circular Diagrams
This solution extends ConceptDraw DIAGRAM software with samples, templates and library of design elements for drawing the Target and Circular Diagrams.
Basic Diagramming


Basic Diagramming

The Best Drawing Program for Mac

Basic Diagramming

Flowchart Example: Flow Chart of Marketing Analysis

Business Tools Perceptual Mapping

Feature Comparison Chart Software

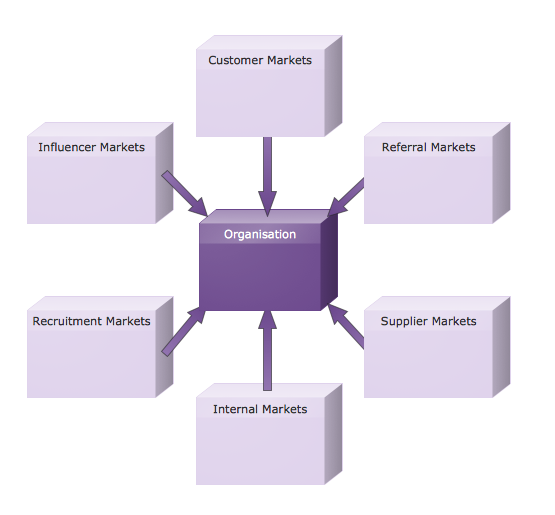
Six Markets Model Chart

Business Diagram Software


Six Markets Model Chart Template

Customizable Six Markets Model Chart Template
Basic Diagramming

- Universal Diagramming Area | Basic Diagramming | Value Stream ...
- Concept Maps | Concept maps with ConceptDraw PRO | Value ...
- Value Stream Mapping | Basic Diagramming | The Best Choice for ...
- Basic Diagramming | Scientific Symbols Chart | Simple Drawing ...
- Timeline Diagrams | Business diagrams & Org Charts with ...
- Business Productivity Diagramming | Workflow Diagram Software ...
- Simple Drawing Applications for Mac | Concept maps with ...
- Pie Charts | Composition Dashboard | What is a Dashboard Area |
- Work Order Process Flowchart. Business Process Mapping Examples
- ConceptDraw PRO Compatibility with MS Visio
- ConceptDraw PRO The best Business Drawing Software
- How to Draw an Organization Chart | Organizational Structure ...
- Room planning with ConceptDraw PRO | Landscape architecture ...
- Business diagrams & Org Charts with ConceptDraw PRO | Work ...
- Marketing | Target market - Onion diagram | Target and Circular ...
- Concept maps with ConceptDraw PRO | Basic Diagramming ...
- The Best Mac Software for Diagramming or Drawing | ConceptDraw ...
- Target and Circular Diagrams | Timeline Diagrams | Management |
- Value Stream Mapping | The Best Choice for Creating Diagram ...
- Best Software to Draw Diagrams | Best Diagramming Software for ...