Database Flowchart Symbols

The vector stencils library "HR arrows" contains 57 arrow pictograms.
Use this arrow icon set to draw your HR flowcharts, workflow diagrams and process charts with the ConceptDraw PRO diagramming and vector drawing software.
The arrow icons library "HR arrows" is included in the HR Flowcharts solution from the Management area of ConceptDraw Solution Park.
Use this arrow icon set to draw your HR flowcharts, workflow diagrams and process charts with the ConceptDraw PRO diagramming and vector drawing software.
The arrow icons library "HR arrows" is included in the HR Flowcharts solution from the Management area of ConceptDraw Solution Park.
Arki arrow
Chevron arrow
Triangle arrow
Small arrow
Up arrow
Down arrow
Right arrow
Left arrow
Vertical moving arrow
Wavy arrow
Fat arrow
Straight arrow
Angle arrow
Double headed arrow
Single headed arrow
Elbow arrow
Crossed arrows
Turn left arrow
Turn right arrow
L-shaped arrow
Corner arrow
Diagonal arrow
Split arrow
Arc arrow
Bent arrow
Go back arrow
Double headed semicircle arrow
Counterclockwise arrow
Sector arrow
Clockwise arrow
Arrow fork
Merging arrows

U-shaped arrow
Semicircle arrow
Circular arrow
Looping arrows
Refresh arrows
Double arc arrow
Curving directional arrow
S-shaped arrow
Short arc arrow
Long arc arrow
Turn round arrow
Rotating arrows
Turned arrow
Curved left arrow
Curved right arrow
Cycle arrow
Arrow loop
Moving down arrow
Moving up arrow
Dual short arc arrow
Recycling arrows

Interaction arrows

Lightning arrow
Ribbon arrow
Circular motion arrows
The vector stencils library "Sales arrows" contains 57 arrow symbols.
Use these arrow icon set to draw your sales flowcharts, workflow diagrams and process charts with the ConceptDraw PRO diagramming and vector drawing software.
The arrow pictograms library "Sales arrows" is included in the Sales Flowcharts solution from the Marketing area of ConceptDraw Solution Park.
Angle arrow
Arc arrow
Arki arrow
Arrow fork
Arrow loop
Bent arrow
Chevron arrow
Circular arrow
Circular motion arrows
Clockwise arrow
Corner arrow
Counterclockwise arrow
Crossed arrows
Curved left arrow
Curved right arrow
Curving directional arrow
Cycle arrow
Diagonal arrow
Double arc arrow
Double headed arrow
Double headed semicircle arrow
Down arrow
Dual short arc arrow
Elbow arrow
Fat arrow
Go back arrow
Interaction arrows

L-shaped arrow
Left arrow
Lightning arrow
Long arc arrow
Looping arrows
Merging arrows

Moving down arrow
Moving up arrow
Recycling arrows

Refresh arrows
Ribbon arrow
Right arrow
Rotating arrows
S-shaped arrow
Sector arrow
Semicircle arrow
Short arc arrow
Single headed arrow
Small arrow
Split arrow
Straight arrow
Triangle arrow
Turn left arrow
Turn right arrow
Turn round arrow
Turned arrow
Up arrow
U-shaped arrow
Vertical moving arrow
Wavy arrow
Keyboard Shortcuts and Mouse Actions

The vector stencils library "HR arrows" contains 57 arrow pictograms.
Use this arrow icon set to draw your HR flowcharts, workflow diagrams and process charts with the ConceptDraw PRO diagramming and vector drawing software.
The arrow icons library "HR arrows" is included in the HR Flowcharts solution from the Management area of ConceptDraw Solution Park.
Use this arrow icon set to draw your HR flowcharts, workflow diagrams and process charts with the ConceptDraw PRO diagramming and vector drawing software.
The arrow icons library "HR arrows" is included in the HR Flowcharts solution from the Management area of ConceptDraw Solution Park.
Arki arrow
Chevron arrow
Triangle arrow
Small arrow
Up arrow
Down arrow
Right arrow
Left arrow
Vertical moving arrow
Wavy arrow
Fat arrow
Straight arrow
Angle arrow
Double headed arrow
Single headed arrow
Elbow arrow
Crossed arrows
Turn left arrow
Turn right arrow
L-shaped arrow
Corner arrow
Diagonal arrow
Split arrow
Arc arrow
Bent arrow
Go back arrow
Double headed semicircle arrow
Counterclockwise arrow
Sector arrow
Clockwise arrow
Arrow fork
Merging arrows
U-shaped arrow
Semicircle arrow
Circular arrow
Looping arrows
Refresh arrows
Double arc arrow
Curving directional arrow
S-shaped arrow
Short arc arrow
Long arc arrow
Turn round arrow
Rotating arrows
Turned arrow
Curved left arrow
Curved right arrow
Cycle arrow
Arrow loop
Moving down arrow
Moving up arrow
Dual short arc arrow
Recycling arrows
Interaction arrows
Lightning arrow
Ribbon arrow
Circular motion arrows
Performance Indicators

Infographic Maker

Mac OS GUI Software

 HR Flowcharts
The HR Flowcharts solution is ideal for using while creating the HR-related drawings in the ConceptDraw DIAGRAM charting and drawing software, providing with a comprehensive collection of human resources themed icons, connectors, and images from the available stencil libraries, helping illustrating flowcharts, infographics and workflow diagrams.
 Infographics Area
Solutions of the area What is Infographics from ConceptDraw Solution Park collect templates, samples and vector stencils libraries with design elements for the drawing information graphics.
Android GUI

Human Resources

Design Pictorial Infographics. Design Infographics

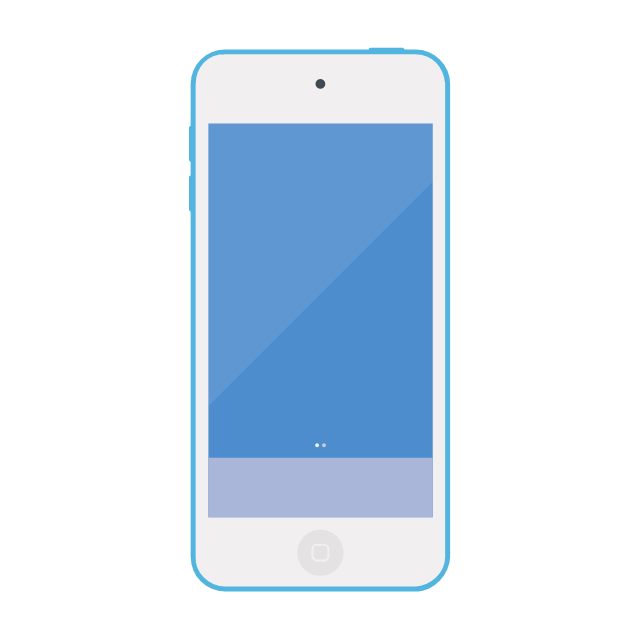
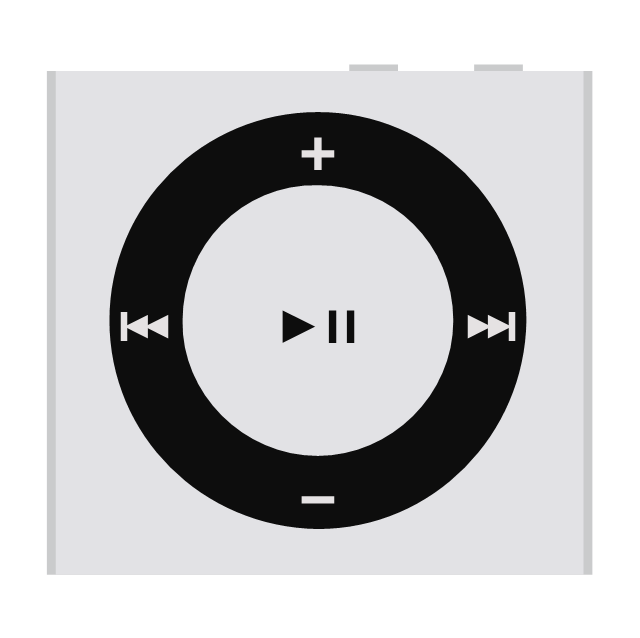
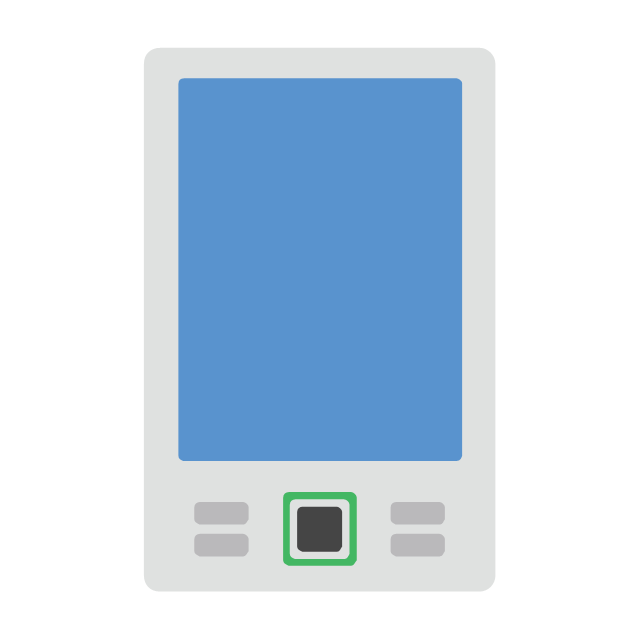
The vector stencils library "Mobile and Phones" contains 46 mobile and phone icons.
Use it to design your audio, video and multimedia illustrations, presentations, web pages and infographics with ConceptDraw PRO diagramming and vector drawing software.
The vector stencils library "Mobile and Phones" is included in the Audio, Video, Media solution from the Illustration area of ConceptDraw Solution Park.
Media player

iPod 1
iPod 2

iPod 3
iPod classic

iPod nano

iPod touch
iPod shuffle
Mobile music

Sound frequency bars

Smartphone 1

Smartphone 2
Send from mobile phone
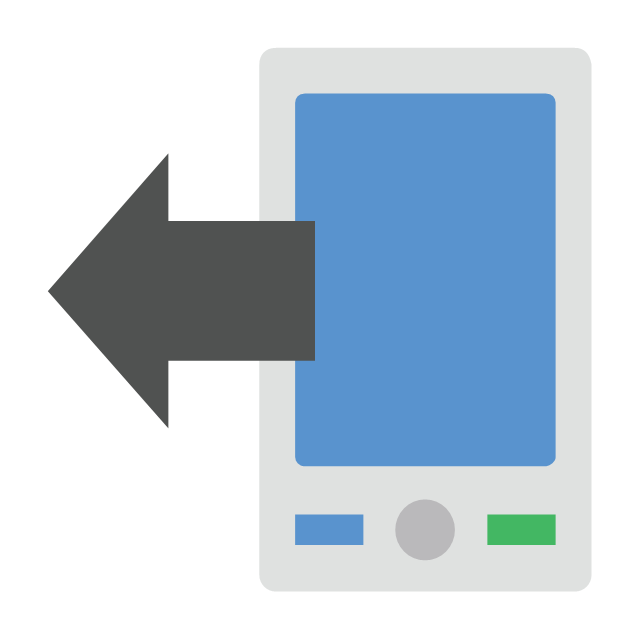
Send to mobile phone
Tablet statistics

Mobile Internet 1

SMS 1

Mobile searching

iPad screen refresh

Mobile business

Mobile chat settings

Mobile access

Mobile map

Mobile payment

Mobile shop

Palm PDA
Tablet 1

Tablet 2

iPad

iPhone

Touchscreen phone

Big screen mobile

Mobile Internet 2

SMS 2

Mobile phone browser

Tablet browser

Mobile cloud computing

Mobile contacts

Android

Apple

Windows

BlackBerry

Desktop phone

IP phone

Cordless phone

Digital phone
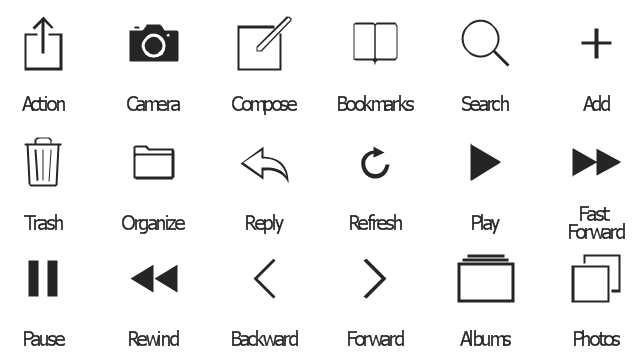
The vector stencils library "Toolbar and Navigation Bar Buttons" contains 18 iOS apps GUI view elements - toolbar and navigation bar buttons: action, camera, compose, bookmarks, search, add, trash, organize, reply, refresh, play, fast forward, pause, rewind, backward, forward, albums, photos.
Use the library "Toolbar and Navigation Bar Buttons" to draw toolbar and navigation bar elements for design of iPhone software applications user interface sketches, mockups and prototypes.
The iOS GUI view elements sample "Design elements - Toolbar and Navigation Bar Buttons" was created using the ConceptDraw PRO diagramming and vector drawing software extended with the iPhone User Interface solution from the Software Development area of ConceptDraw Solution Park.
iOS GUI views - Toolbar and Navigation Bar Buttons
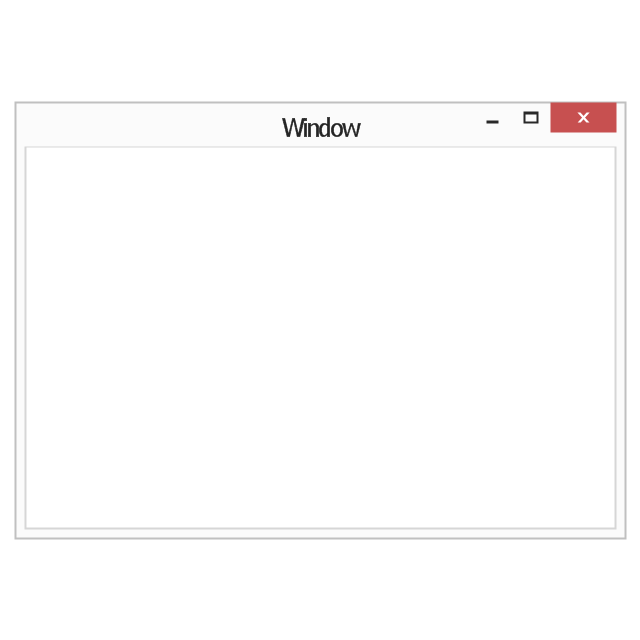
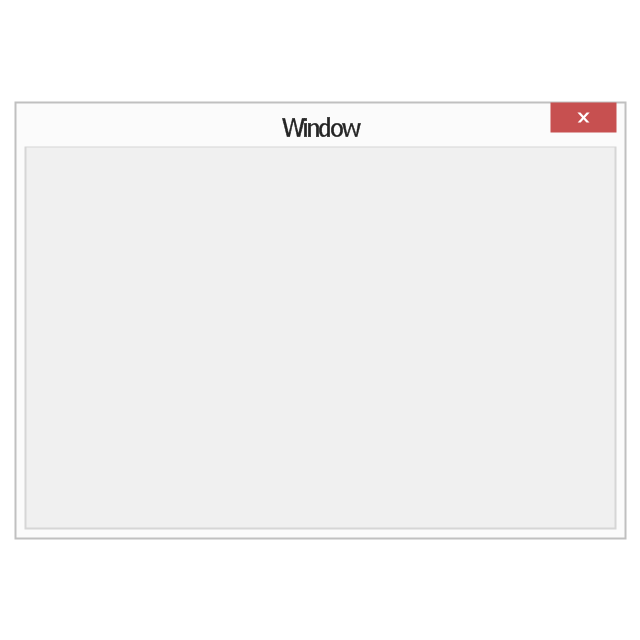
The vector stencils library "Window elements" contains 24 window elements: frames, boxes and buttons.
Use it to design graphic user interface (GUI) of your Windows 8 software application.
"A window is a graphical control element. It consists of a visual area containing some of the graphical user interface of the program it belongs to and is framed by a window decoration. It usually has a rectangular shape that can overlap with the area of other windows. It displays the output of and may allow input to one or more processes.
Windows are primarily associated with graphical displays, where they can be manipulated with a pointer by employing some kind of pointing device.
A graphical user interface (GUI) using windows as one of its main "metaphors" is called a windowing system, whose main components are the display server and the window manager." [Window (computing). Wikipedia]
The design elements example "Window elements - Vector stencils library" was created using the ConceptDraw PRO diagramming and vector drawing software extended with the Windows 8 User Interface solution from the Software Development area of ConceptDraw Solution Park.
Window frame
Dialog box
Window with command area
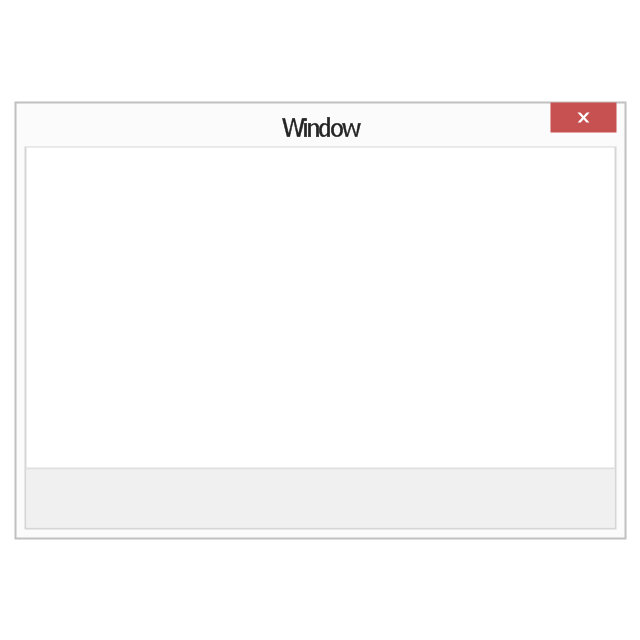
Command area

Close window button

Minimize window button

Restore window button

Maximize window button

Minimize window button - hover

Restore window button - hover

Maximize window button - hover

Window resize handle

Vertical separator

Horizontal separator

Back button

Forward button

Forward

Back

Warning icon
Error icon
Information icon
Question mark icon
Refresh icon
Up control

User Interface Design Examples

GUI Software

The vector stencils library "HR arrows" contains 57 arrow shapes.
Use it to design your HR flowcharts, workflow diagrams, process charts and infographics by the ConceptDraw PRO diagramming and vector drawing software.
The shapes example "Design elements - HR arrows" is included in the HR Flowcharts solution from the Management area of ConceptDraw Solution Park.
Use it to design your HR flowcharts, workflow diagrams, process charts and infographics by the ConceptDraw PRO diagramming and vector drawing software.
The shapes example "Design elements - HR arrows" is included in the HR Flowcharts solution from the Management area of ConceptDraw Solution Park.
Arrow connectors for HR flowcharts
 CRM Center Dashboard
The CRM Center Dashboard solution extends ConceptDraw DIAGRAM functionality with CRM software tools, large collection of CRM Charts live objects, CRM icons, CRM indicators, CRM maps and navigation elements, the set of professionally designed CRM samples and templates to help you construct your own CRM Dashboards and CRM Center Dashboards in a few minutes, to depict the current and actual data by connecting or refreshing the data source file. The customer management software ConceptDraw DIAGRAM makes you free to choose the style for your dashboard and to regulate the quantity of clipart on the diagram according to your taste.
- Glyph icons - Vector stencils library | Sample Project Flowchart ...
- Basic Flowchart Symbols and Meaning | Progressive disclosure ...
- Refresh Icon In Material Icons Android
- How to Connect a Live Object to a Text Data Source | How to ...
- Refresh Android Drawer Menu Png
- Glyph icons - Vector stencils library | Design elements - Toolbar and ...
- How to Draw a Circular Arrows Diagram Using ConceptDraw PRO ...
- How To Do A Mind Map In PowerPoint | Process Flowchart | iPhone ...
- Product Overview | ConceptDraw PRO: Able to Leap Tall Buildings ...
- Basic Flowchart Symbols and Meaning | ConceptDraw Arrows10 ...