 Cross-Functional Flowcharts
Cross-functional flowcharts are powerful and useful tool for visualizing and analyzing complex business processes which requires involvement of multiple people, teams or even departments. They let clearly represent a sequence of the process steps, the order of operations, relationships between processes and responsible functional units (such as departments or positions).
 Data Flow Diagrams (DFD)
Data Flow Diagrams solution extends ConceptDraw PRO software with templates, samples and libraries of vector stencils for drawing the data flow diagrams (DFD).
 Audit Flowcharts
Audit flowcharts solution extends ConceptDraw PRO software with templates, samples and library of vector stencils for drawing the audit and fiscal flow charts.
 Flowcharts
Flowcharts solution extends ConceptDraw PRO software with samples, templates and library of vector stencils for drawing the flow charts.
HelpDesk
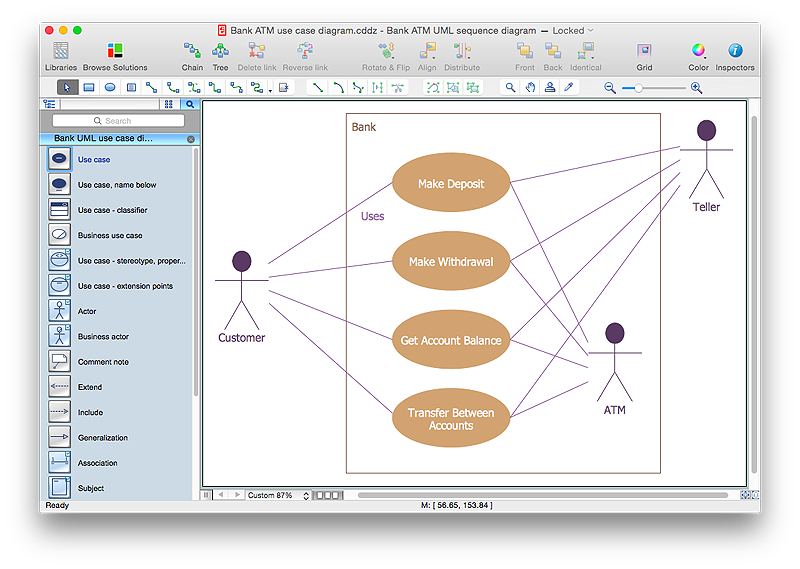
How to Create a Bank ATM Use Case Diagram Using ConceptDraw PRO
UML diagrams are often used in banking management for documenting a banking system. In particular, the interaction of bank customers with an automated teller machine (ATM) can be represented in a Use Case diagram. Before the software code for an ATM, or any other system design, is written, it is necessary to create a visual representation of any object-oriented processes. This is done most effectively by creating a Unified Modeling Language (UML) diagram, using object-oriented modeling. UML works as a general purpose modeling language for software engineers or system analysts, offering a number of different diagram styles with which to visually depict all aspects of a software system.ConceptDraw PRO diagramming software, enhanced and expanded with the ATM UML Diagrams solution, offers the full range of icons, templates and design elements needed to faithfully represent ATM and banking information system architecture using UML standards. The ATM UML Diagrams solution is useful for beginner and advanced users alike. More experienced users will appreciate a full range of vector stencil libraries and ConceptDraw PRO's powerful software, that allows you to create your ATM UML diagram in a matter of moments.
 Accounting Flowcharts
Accounting Flowcharts solution extends ConceptDraw PRO software with templates, samples and library of vector stencils for drawing the accounting flow charts.
 ATM UML Diagrams
The ATM UML Diagrams solution lets you create ATM solutions and UML examples. Use ConceptDraw PRO as a UML diagram creator to visualize a banking system.
 Fishbone Diagrams
Fishbone Diagrams solution extends ConceptDraw PRO software with templates, samples and library of vector stencils for drawing the Ishikawa diagrams for cause and effect analysis.
 Interactive Voice Response Diagrams
Interactive Voice Response Diagrams solution extends ConceptDraw PRO v10 with samples, templates and library of ready-to-use vector stencils to help create Interactive Voice Response (IVR) diagrams illustrating a work of interactive voice response system, Voice-over-Internet Protocol (VoIP) diagrams and Action VoIP diagrams with representing voice actors on them.
 Business Process Diagrams
The Business Process Diagram Solution extends ConceptDraw PRO v10 BPMN software with its RapidDraw interface, templates, samples, and libraries based on the BPMN 1.2 and BPMN 2.0 standards. This powerful solution permits you to visualize easily both simple and complex processes, as well as design business models. The Business Process Diagram solution allows one to quickly develop and document in detail any business processes at any stage of a project’s planning and implementation.
 Accounting Flowcharts
Accounting Flowcharts solution extends ConceptDraw PRO software with templates, samples and library of vector stencils for drawing the accounting flow charts.
 Social Media Response
This solution extends ConceptDraw PRO and ConceptDraw MINDMAP with the ability to draw interactive flow charts with action mind map templates, to help create an effective response to applicable social media mentions.
 Fishbone Diagram
Fishbone Diagrams solution extends ConceptDraw PRO software with templates, samples and library of vector stencils for drawing the Ishikawa diagrams for cause and effect analysis.
 Event-driven Process Chain (EPC) Diagrams
Event-driven Process Chain (EPC) Diagram is a type of flowchart widely used for modeling in business engineering and reengineering, business process improvement, and analysis. EPC method was developed within the Architecture of Integrated Information Systems (ARIS) framework.
- Flow Chart Banking System
- Flowchart For Banking Management System
- Multi Banking System Uml Diagrams
- UML use case diagram - Banking system | UML for Bank | Flowchart ...
- Control Flow Diagram Of Banking System
- Flowchart Of Multi Banking System
- Class UML Diagram for Bank Account System | Audit Flowcharts ...
- Package Diagram With Example In Banking System Model
- Banking System Flowchart
- Process Flowchart | Business Process Diagram | Data Flow ...
- System Flowchart Banking System
- UML Deployment Diagram Example - ATM System | UML Diagram ...
- Sequence Diagramfor Multi Banking System
- Sequence Diagram For Banking System
- Flowchart Of Banking System
- Sequence Diagram For Multi Banking System
- UML use case diagram - Banking system | How to Create a Bank ...
- Process Flowchart | Bank System | Design elements - Bank UML ...
- Use Case Diagram For Banking System In Uml
- Flowchart For Banking System
