Value stream with ConceptDraw PRO

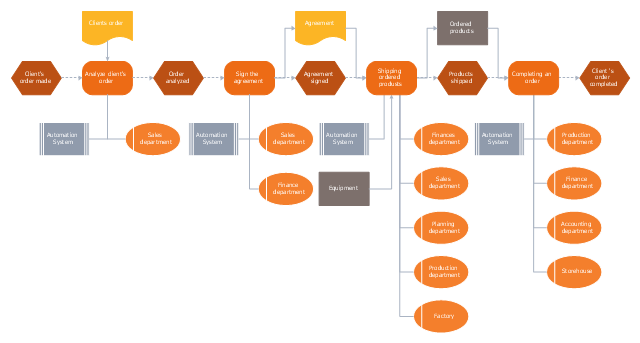
"Order processing is a key element of Order fulfillment. Order processing operations or facilities are commonly called "distribution centers". "Order processing" is the term generally used to describe the process or the work flow associated with the picking, packing and delivery of the packed item(s) to a shipping carrier. The specific "order fulfillment process" or the operational procedures of distribution centers are determined by many factors. Each distribution center has its own unique requirements or priorities. There is no "one size fits all" process that universally provides the most efficient operation." [Order processing. Wikipedia]
The business process modeling (BPM) flowchart example "Order processing - EPC flow chart" was created using the ConceptDraw PRO diagramming and vector drawing software extended with the Event-driven Process Chain Diagrams solution from the Business Processes area of ConceptDraw Solution Park.
The business process modeling (BPM) flowchart example "Order processing - EPC flow chart" was created using the ConceptDraw PRO diagramming and vector drawing software extended with the Event-driven Process Chain Diagrams solution from the Business Processes area of ConceptDraw Solution Park.
EPC flow chart
Value Stream & Process Flow Diagramming Software

Value Stream Mapping Symbols

Business Processes description with ConceptDraw PRO

Value Stream Mapping for the Lean Office
")
"Value Stream Mapping (VSM):
– Special type of flow chart that uses symbols known as "the language of Lean" to depict and improve the flow of inventory information. ...
Value Stream Mapping ...
Provide optimum value to the customer through a complete value creation process with minimum waste in:
– Design (concept to customer);
– Design (concept to customer);
– Build (order to delivery);
– Sustain (in-use through life cycle to service)." [courses.washington.edu/ ie337/ Value_ Stream_ Mapping.pdf]
This sample Value Stream Map shows how customer value is created in the steps of manufacturing, production control, and shipping processes.
This VSM example was created using the ConceptDraw PRO diagramming and vector drawing software extended with the Value Stream Mapping solution from the Quality area of ConceptDraw Solution Park.
Value stream mapping

Accounting Flowchart Purchasing Receiving Payable and Payment

Flow chart Example. Warehouse Flowchart


Material Requisition Flowchart. Flowchart Examples

Example of DFD for Online Store (Data Flow Diagram) DFD Example


Kanban Board Software

What is Value Stream Mapping?

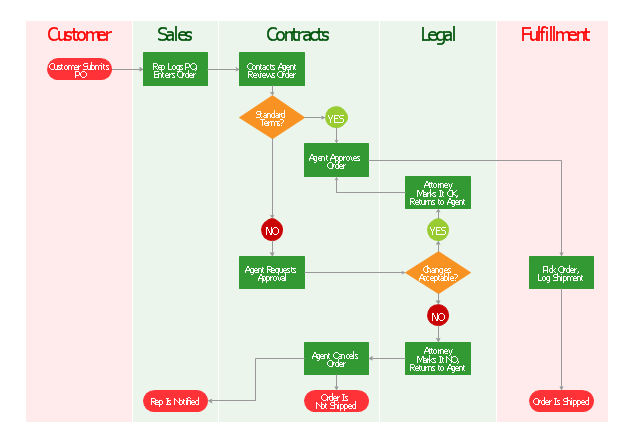
"Order processing is a key element of Order fulfillment. Order processing operations or facilities are commonly called "distribution centers". "Order processing" is the term generally used to describe the process or the work flow associated with the picking, packing and delivery of the packed item(s) to a shipping carrier. The specific "order fulfillment process" or the operational procedures of distribution centers are determined by many factors. Each distribution center has its own unique requirements or priorities." [Order processing. Wikipedia]
The vertical cross-functional flow chart example "Order processing" was created using the ConceptDraw PRO diagramming and vector drawing software extended with the Flowcharts solution from the area "What is a Diagram" of ConceptDraw Solution Park.
The vertical cross-functional flow chart example "Order processing" was created using the ConceptDraw PRO diagramming and vector drawing software extended with the Flowcharts solution from the area "What is a Diagram" of ConceptDraw Solution Park.
Cross-functional flowchart
Stakeholder Management System

- Order To Delivery Process Flow Chart
- Delivery Creation Flow Chart
- Flow chart Example. Warehouse Flowchart | Process Flowchart ...
- Order Processing Process Flow Chart
- Order Delivery Process Flow Chart
- Order To Delivery Process Flow
- Order Fulfillment Flow Chart
- Order processing - Cross-functional flowchart | Order processing ...
- Order processing - EPC flow chart | Order processing - Cross ...
- Process Flowchart | Data Flow Diagram Model | Basic Flowchart ...
- Data Flow Diagram Of Purchase Order Sample
- Order processing - EPC flow chart | EPC Diagrams Illustrate ...
- Material Requisition Flowchart. Flowchart Examples | Flow chart ...
- Order Processing Flow Chart
- Order processing - EPC flow chart | Modelling Complex Events with ...
- Delivery Process Flow Chart
- Food Delivery Process Flow Chart
- Work Order Process Flowchart. Business Process Mapping Examples
- Order Process Flow