This vector stencils library contains 47 SysML activity diagram symbols.
Use it to design your SysML activity diagrams using ConceptDraw PRO diagramming and vector drawing software.
"Activity diagrams are constructed from a limited number of shapes, connected with arrows. The most important shape types:
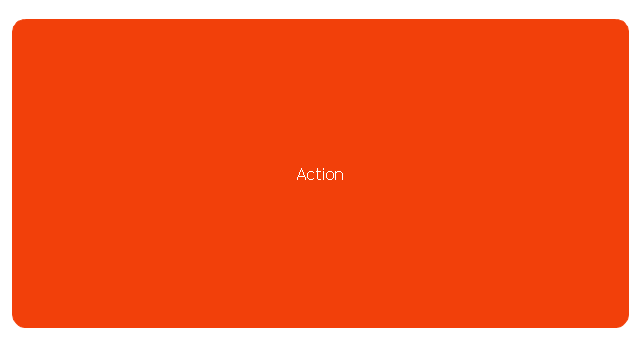
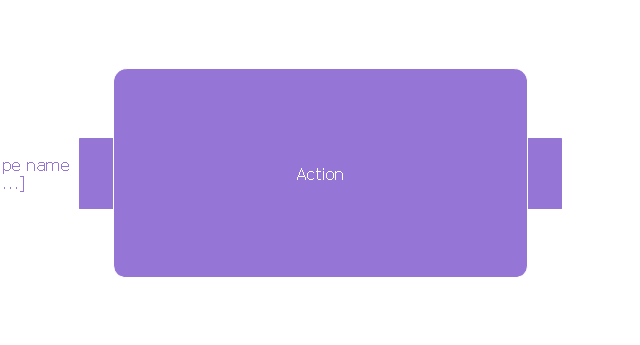
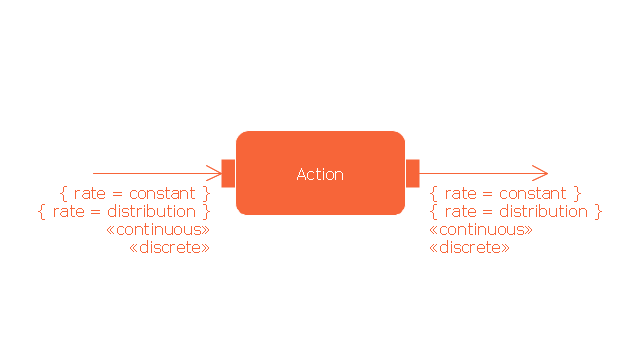
- rounded rectangles represent actions;
- diamonds represent decisions;
- bars represent the start (split) or end (join) of concurrent activities;
- a black circle represents the start (initial state) of the workflow;
- an encircled black circle represents the end (final state).
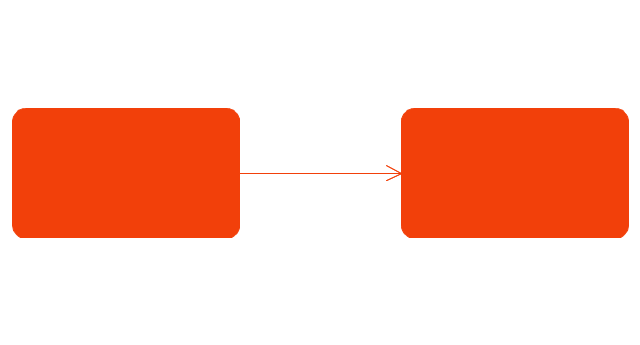
Arrows run from the start towards the end and represent the order in which activities happen." [Activity diagram. Wikipedia]
The vector stencils library "Activity diagram" is included in the SysML solution from the Software Development area of ConceptDraw Solution Park.
Use it to design your SysML activity diagrams using ConceptDraw PRO diagramming and vector drawing software.
"Activity diagrams are constructed from a limited number of shapes, connected with arrows. The most important shape types:
- rounded rectangles represent actions;
- diamonds represent decisions;
- bars represent the start (split) or end (join) of concurrent activities;
- a black circle represents the start (initial state) of the workflow;
- an encircled black circle represents the end (final state).
Arrows run from the start towards the end and represent the order in which activities happen." [Activity diagram. Wikipedia]
The vector stencils library "Activity diagram" is included in the SysML solution from the Software Development area of ConceptDraw Solution Park.
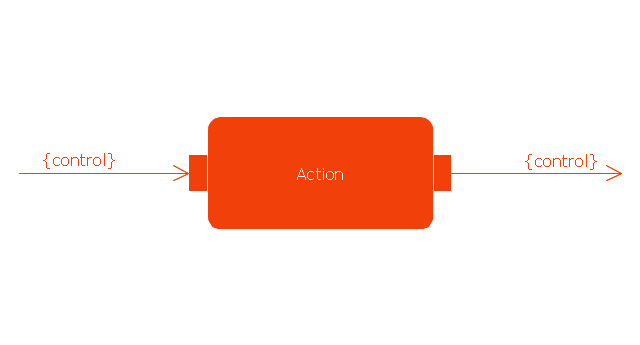
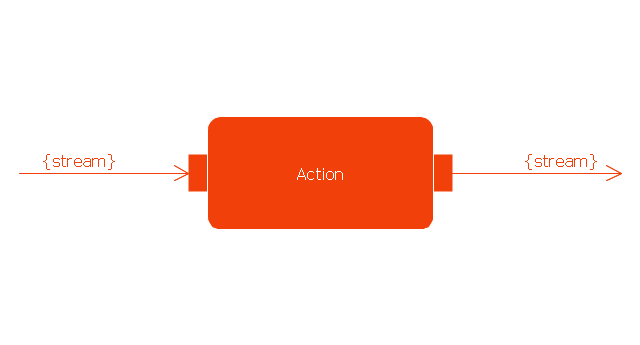
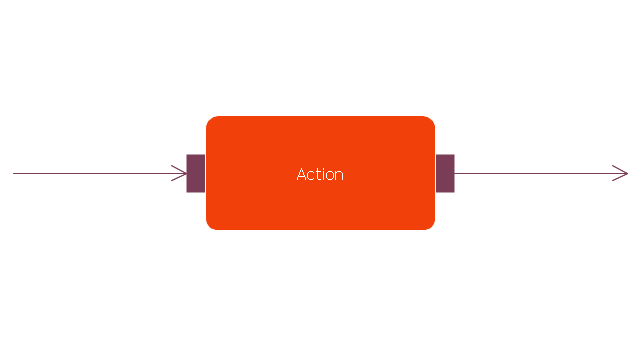
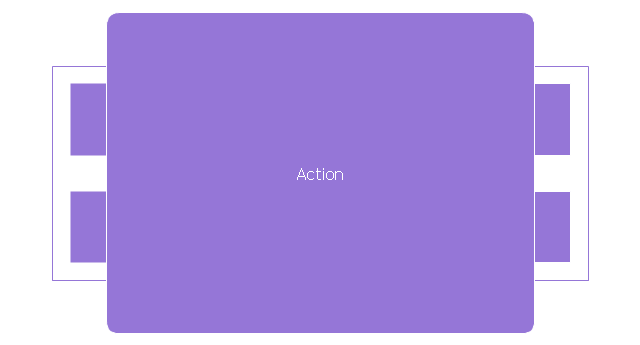
Action
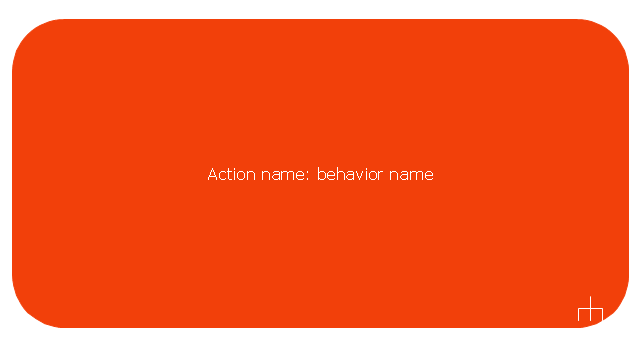
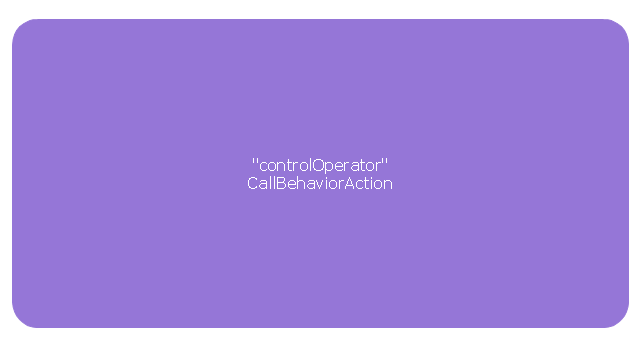
Call behavior action
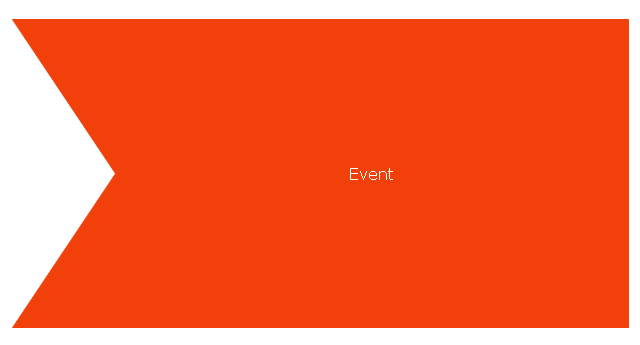
Accept event action
Accept time event action

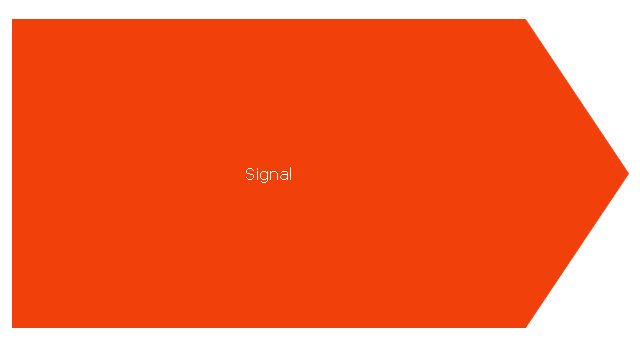
Send signal action
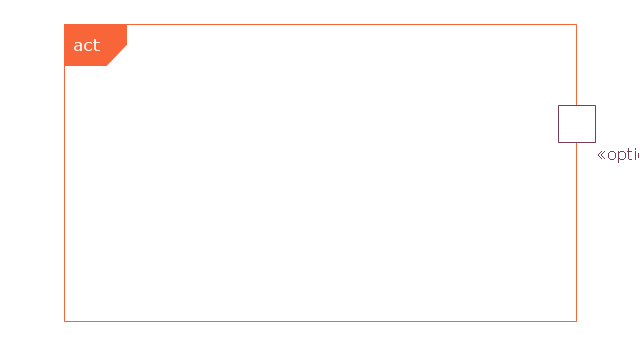
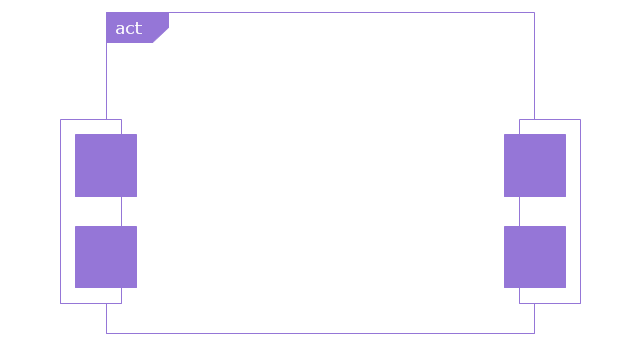
Activity
Activity final node
Flow final node
Activity parameter node
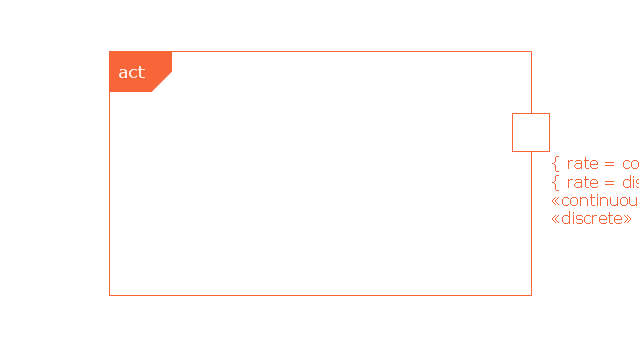
Control operator node
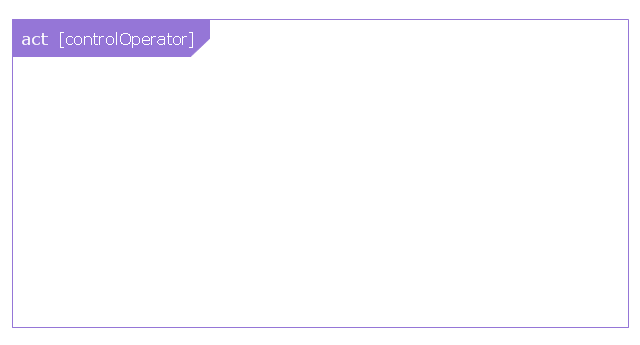
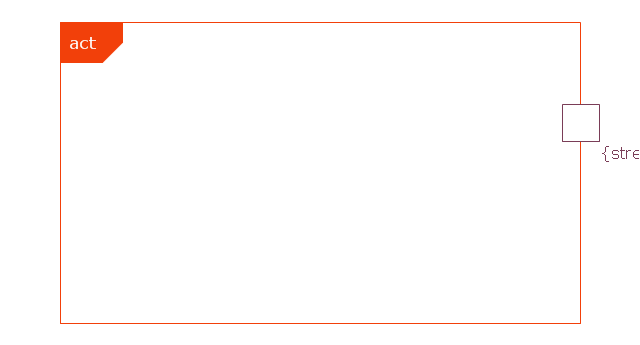
Control operator - frame
Decision/Merge node

Fork/Join node
Initial node
isControl
isStream
isStream 2
isStream 3
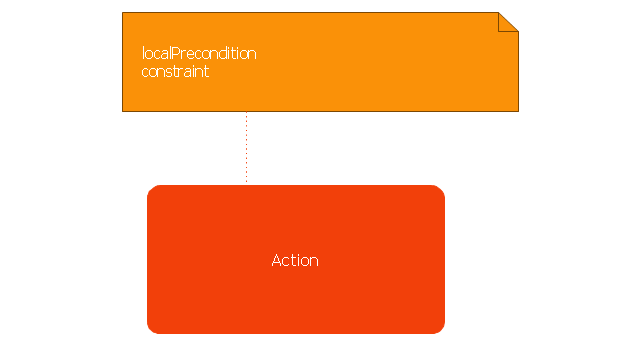
Local precondition
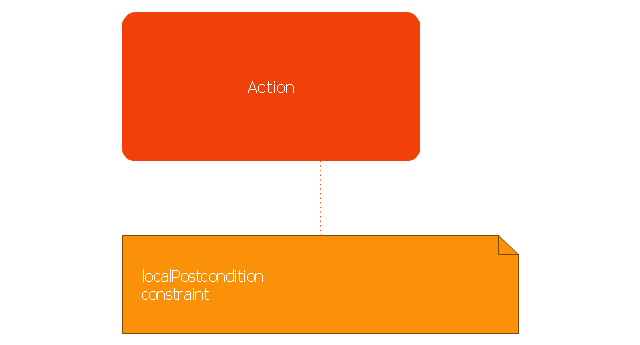
Local postcondition
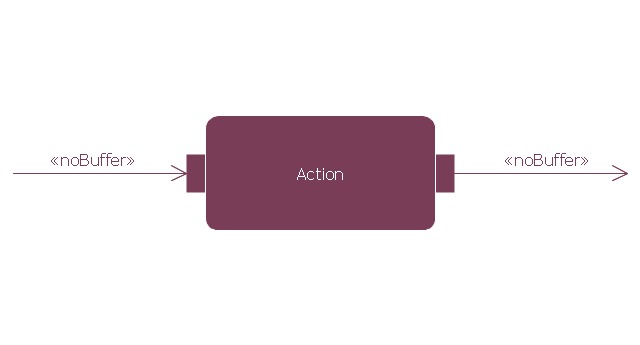
NoBuffer
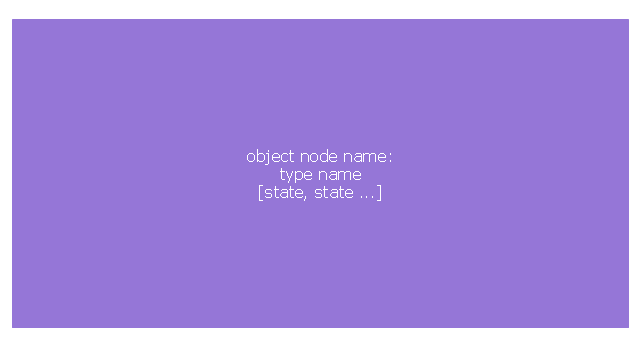
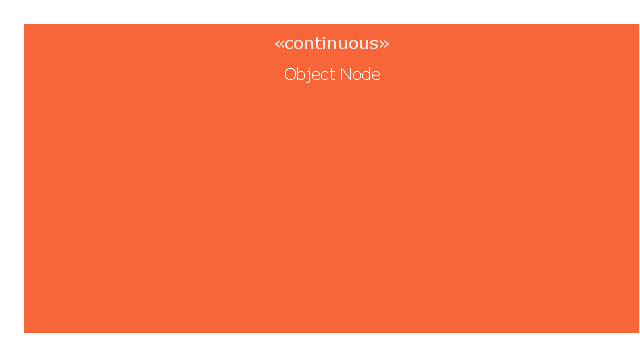
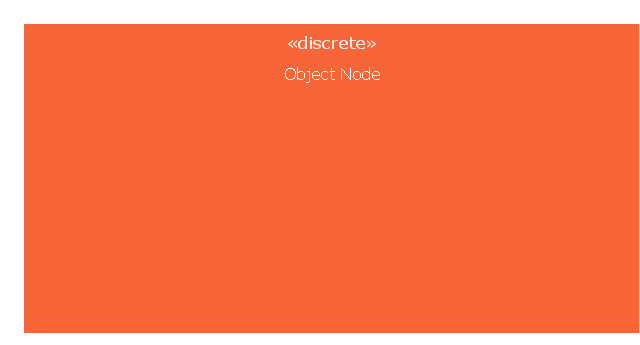
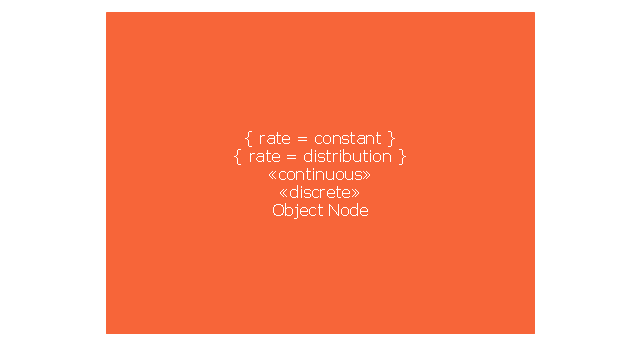
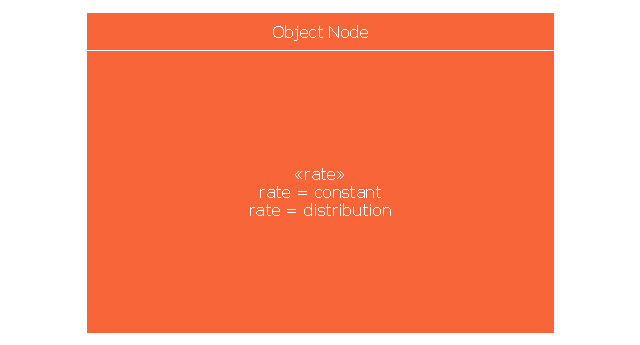
Object node
Object node 2
Optional
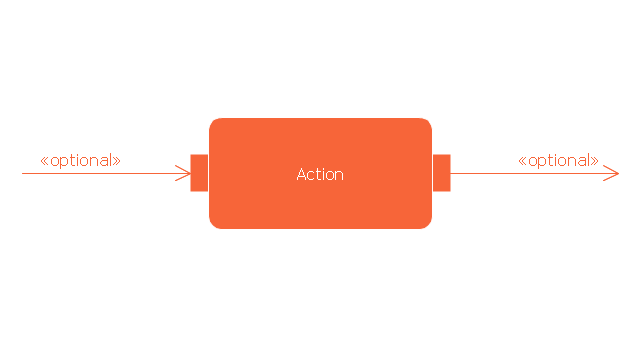
Optional 2
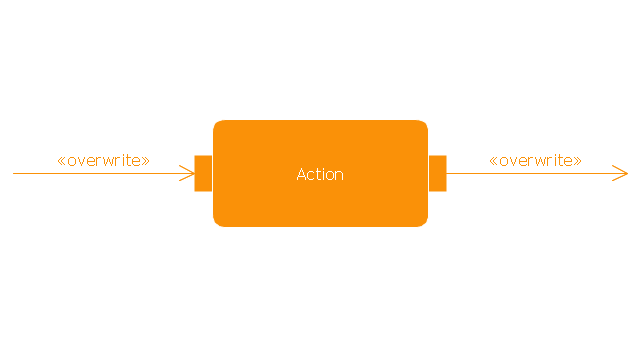
OverWrite
Parameter set
Parameter set 2
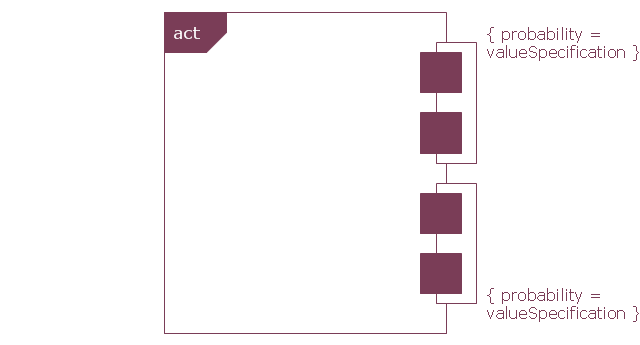
Probability
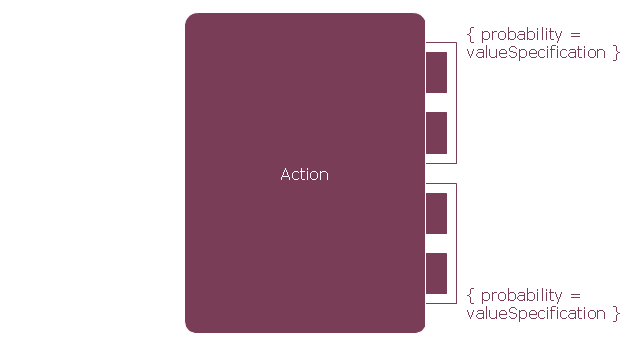
Probability 2
Rate
Rate 2
Rate 3
Rate 4
Rate 5
Rate 6
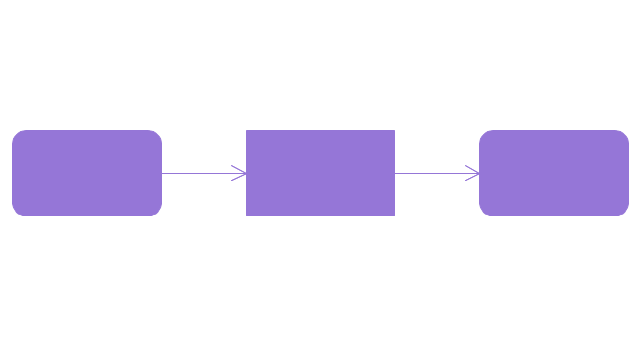
Control flow
Control flow 2
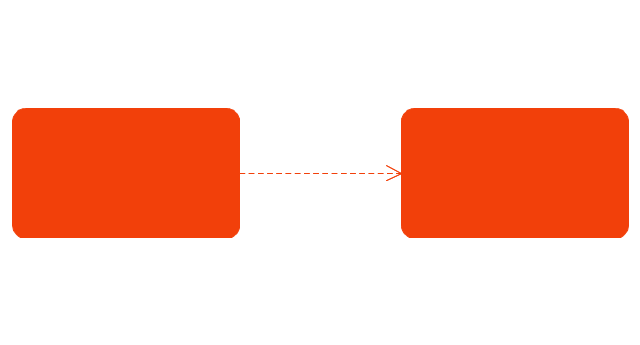
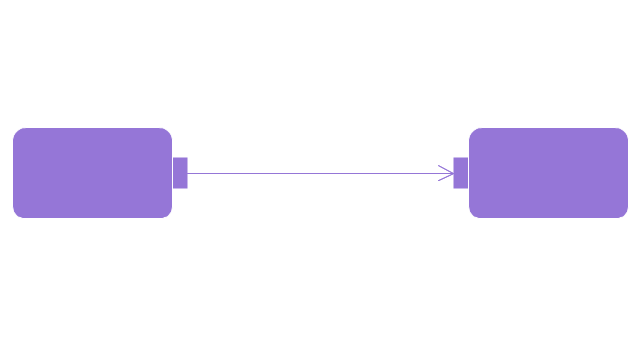
Object flow
Object flow 2
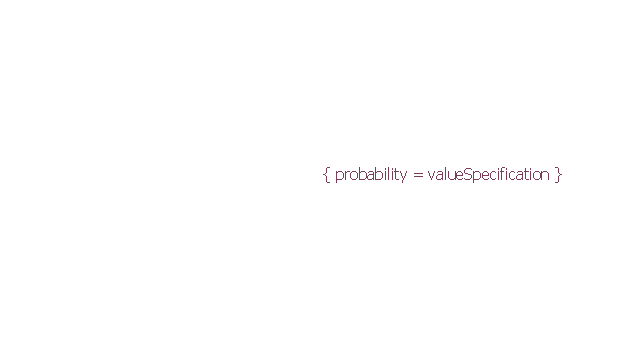
Probability path
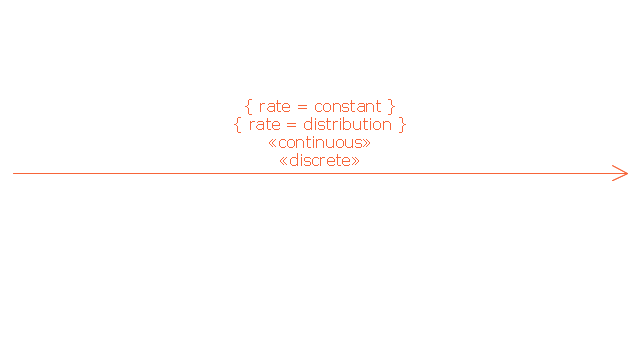
Rate path
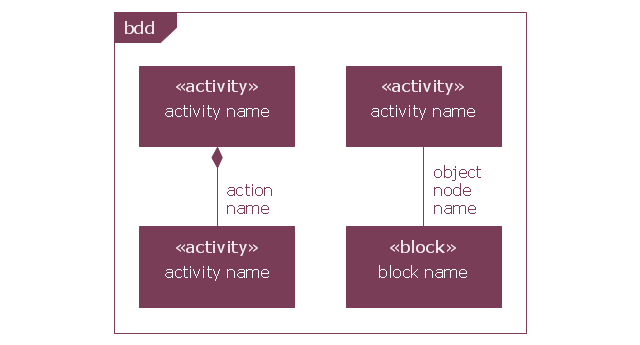
In block definition diagram, activity, association
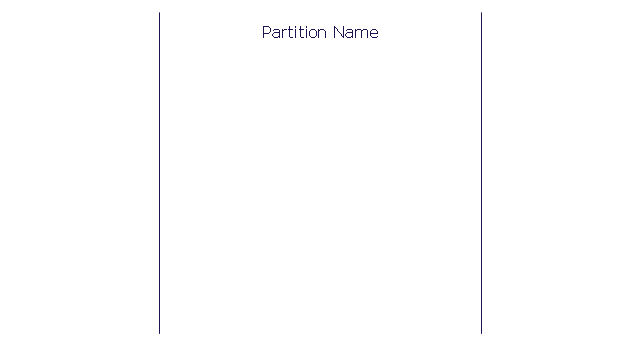
Activity partition
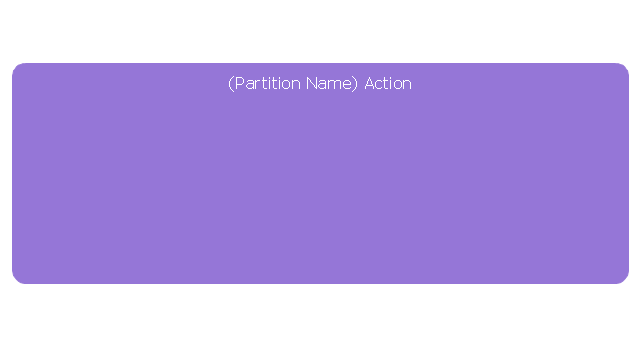
Activity partition - action
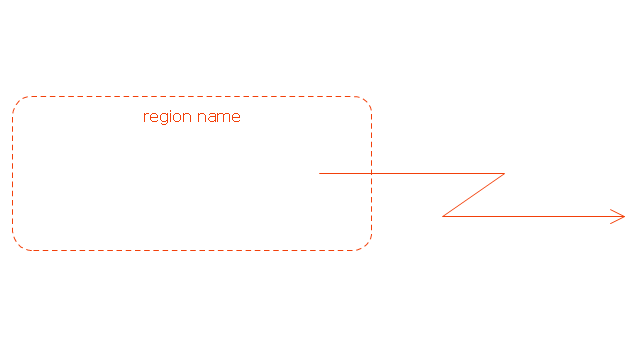
Interruptible activity region
Structured activity node
This vector stencils library contains 47 SysML activity diagram symbols.
Use it to design your SysML activity diagrams using ConceptDraw PRO diagramming and vector drawing software.
"Activity diagrams are constructed from a limited number of shapes, connected with arrows. The most important shape types:
- rounded rectangles represent actions;
- diamonds represent decisions;
- bars represent the start (split) or end (join) of concurrent activities;
- a black circle represents the start (initial state) of the workflow;
- an encircled black circle represents the end (final state).
Arrows run from the start towards the end and represent the order in which activities happen." [Activity diagram. Wikipedia]
The vector stencils library "Activity diagram" is included in the SysML solution from the Software Development area of ConceptDraw Solution Park.
Action
Call behavior action
Accept event action
Accept time event action
Send signal action
Activity
Activity final node
Flow final node
Activity parameter node
Control operator node
Control operator - frame
Decision/Merge node
Fork/Join node
Initial node
isControl
isStream
isStream 2
isStream 3
Local precondition
Local postcondition
NoBuffer
Object node
Object node 2
Optional
Optional 2
OverWrite
Parameter set
Parameter set 2
Probability
Probability 2
Rate
Rate 2
Rate 3
Rate 4
Rate 5
Rate 6
Control flow
Control flow 2
Object flow
Object flow 2
Probability path
Rate path
In block definition diagram, activity, association
Activity partition
Activity partition - action
Interruptible activity region
Structured activity node
UML Activity Diagram. Design Elements
")

This vector stencils library contains 47 SysML activity diagram symbols.
Use it to design your SysML activity diagrams using ConceptDraw PRO diagramming and vector drawing software.
"Activity diagrams are constructed from a limited number of shapes, connected with arrows. The most important shape types:
- rounded rectangles represent actions;
- diamonds represent decisions;
- bars represent the start (split) or end (join) of concurrent activities;
- a black circle represents the start (initial state) of the workflow;
- an encircled black circle represents the end (final state).
Arrows run from the start towards the end and represent the order in which activities happen." [Activity diagram. Wikipedia]
The vector stencils library "Activity diagram" is included in the SysML solution from the Software Development area of ConceptDraw Solution Park.
Use it to design your SysML activity diagrams using ConceptDraw PRO diagramming and vector drawing software.
"Activity diagrams are constructed from a limited number of shapes, connected with arrows. The most important shape types:
- rounded rectangles represent actions;
- diamonds represent decisions;
- bars represent the start (split) or end (join) of concurrent activities;
- a black circle represents the start (initial state) of the workflow;
- an encircled black circle represents the end (final state).
Arrows run from the start towards the end and represent the order in which activities happen." [Activity diagram. Wikipedia]
The vector stencils library "Activity diagram" is included in the SysML solution from the Software Development area of ConceptDraw Solution Park.
Action
Call behavior action
Accept event action
Accept time event action
Send signal action
Activity
Activity final node
Flow final node
Activity parameter node
Control operator node
Control operator - frame
Decision/Merge node
Fork/Join node
Initial node
isControl
isStream
isStream 2
isStream 3
Local precondition
Local postcondition
NoBuffer
Object node
Object node 2
Optional
Optional 2
OverWrite
Parameter set
Parameter set 2
Probability
Probability 2
Rate
Rate 2
Rate 3
Rate 4
Rate 5
Rate 6
Control flow
Control flow 2
Object flow
Object flow 2
Probability path
Rate path
In block definition diagram, activity, association
Activity partition
Activity partition - action
Interruptible activity region
Structured activity node
Flow chart Example. Warehouse Flowchart


 Logistics Flow Charts
Logistics Flow Charts solution extends ConceptDraw PRO v11 functionality with opportunities of powerful logistics management software. It provides large collection of predesigned vector logistic symbols, pictograms, objects and clipart to help you design with pleasure Logistics flow chart, Logistics process flow diagram, Inventory flow chart, Warehouse flowchart, Warehouse management flow chart, Inventory control flowchart, or any other Logistics diagram. Use this solution for logistics planning, to reflect logistics activities and processes of an enterprise or firm, to depict the company's supply chains, to demonstrate the ways of enhancing the economic stability on the market, to realize logistics reforms and effective products' promotion.
Accounting Data Flow from the Accounting Flowcharts Solution

Diagram Flow Chart

Flowchart Marketing Process. Flowchart Examples

Value stream with ConceptDraw PRO

Data Flow Diagram (DFD)
")
Process Flowchart


UML Interaction Overview Diagram. Design Elements

Data Flow Diagram Software

How To Create a Flow Chart in ConceptDraw

- Flow Digram From Source To Final Utilisation Of Biomass
- Boimass Flow Diagram Source To Final Utilisation
- Include A Detailed Flow Diagram From Source To Final Utilisation Of ...
- Vector stencils library - Activity diagram
- Picture Graphs | Flow Diagram From Source To Final Utilisation Of ...
- A Flow Diagram Of Biofuel From Source To Final Utilisation
- Detailed Flow Diagram From Source To Final Utilisation Of What
- The Flow Diagram Of An Biomass From Source To Final Utilisation
- Www Detailed Flow Diagram From Biomass To Final Utlilisation
- Include A Detail Flow Diagram Of Biofuel From Source To Final ...
- A Detailed Flow Diagram To Show Information From Source To Final ...
- Detailed Flow Diagram To Final Utilisation Of Wave Energy
- Flow Diagram Source To Final Utilisation For Biomass And Fuel
- Detailed Flow Diagram To Final Utilisation Of Biofuel
- A Detailed Flow Diagram From Wave Energybto Final Utilisation
- Detailed Flow Diagram Include A Source To Final Utilisation Of ...
- A Flow Diagram Of Biomass From Source To Final Utilisation
- Flow Diagram From Source To Final Utilisation Of Wave Energy
- Detailed Flow Diagram From Source To Final Utilisation Of An Wave