This site uses cookies. By continuing to browse the ConceptDraw site you are agreeing to our Use of Site Cookies.

JSD - Jackson system development
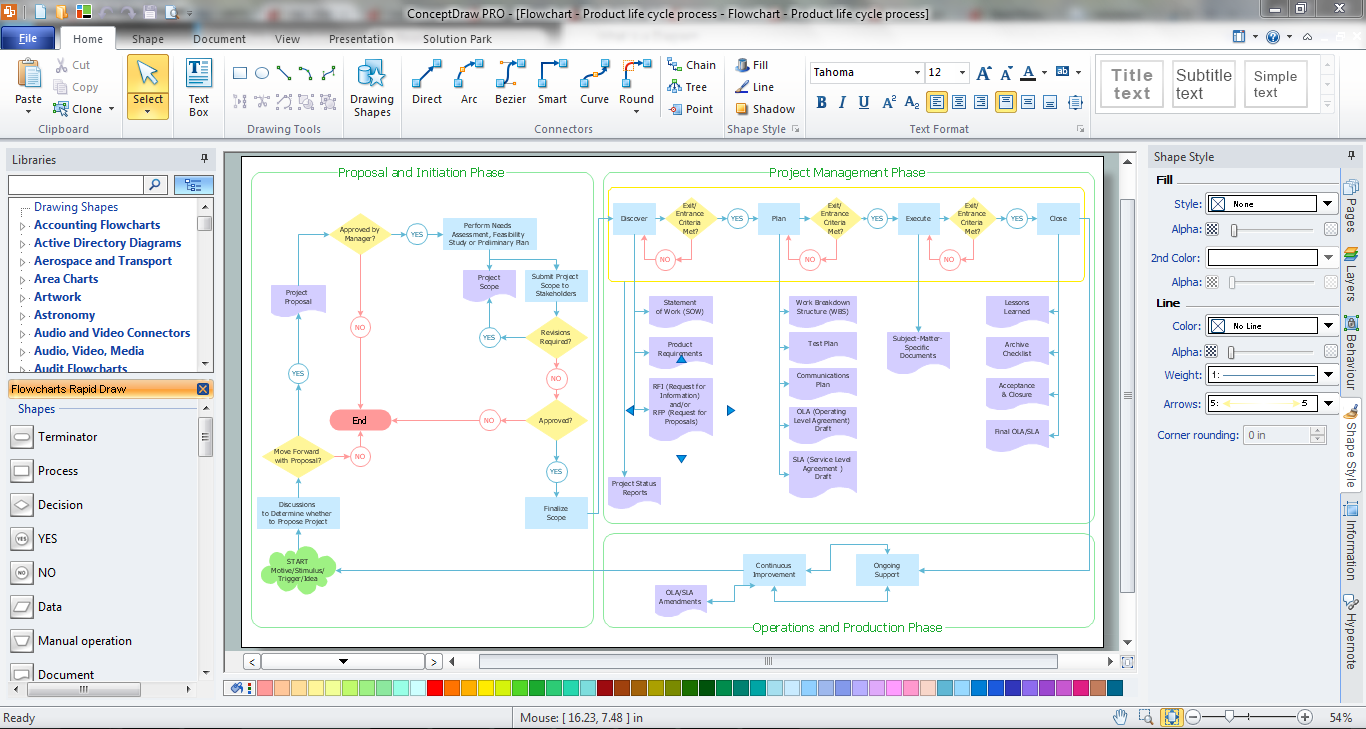
Jackson System Development (JSD) is a linear method of system development created by Michael A. Jackson and John Cameron in the 1980s. It comprises the whole software life cycle directly or providing a framework for more specialized techniques.
When implementing the Jackson System Development method and designing JSD diagrams, you can succesfully use the powerful and helpful tools of ConceptDraw DIAGRAM software extended with Entity-Relationship Diagram (ERD) solution from the Software Development area of ConceptDraw Solution Park.

Flow Chart Creator

It is impossible to imagine the managing and analyzing of business and technical processes without flowcharts. They are the best way to visually represent the structural data, algorithms, the steps of the process, they allow to illustrate the process flow direction and solution to a given problem. ConceptDraw DIAGRAM diagramming and vector drawing software extended with flowchart maker and Flowcharts Solution from the "Diagrams" Area is a powerful Flow Chart Creator.

Cloud Computing Architecture Diagrams

For documenting the Cloud Computing Architecture with a goal to facilitate the communication between stakeholders are successfully used the Cloud Computing Architecture diagrams. It is convenient and easy to draw various Cloud Computing Architecture diagrams in ConceptDraw DIAGRAM software with help of tools of the Cloud Computing Diagrams Solution from the Computer and Networks Area of ConceptDraw Solution Park.

How to Build Cloud Computing Diagram Principal Cloud Manufacturing

The term “cloud” is very popular and widely used now, it is a server, data processing centre, or a network which lets to store the data and software, provides access to them, allows to run applications without installation and gives the possibility to process data hosted remotely via the Internet connection.
For documenting the Cloud Computing Architecture with a goal to facilitate the communication between stakeholders are successfully used the Cloud Computing Architecture diagrams. It is convenient and easy to draw various Cloud Computing Architecture diagrams in ConceptDraw DIAGRAM software with help of tools of the Cloud Computing Diagrams Solution from the Computer and Networks Area of ConceptDraw Solution Park.

Amazon Web Services Diagrams diagramming tool for architecture

The AWS Architecture Diagrams solution includes icons, sample and templates for several Amazon Web Services products and resources, to be used when creating architecture diagrams. The icons are designed to be simple so that you can easily incorporate them in your diagrams and put them in your whitepapers, presentations, datasheets, posters or any technical material you like. Here you will find an official collection of AWS resources that will help you build great AWS Architecture diagrams.

ConceptDraw Solution Park ConceptDraw Solution Park

ConceptDraw Solution Park
ConceptDraw Solution Park collects graphic extensions, examples and learning materials

Architecture Diagrams

The Architecture Diagrams are the type of diagrams which help to system designers, system developers, and application developers to visualize the overall high-level structure of the system or application and depict the interactions between software systems, users, external systems, data sources, and services. The ConceptDraw DIAGRAM Architecture Diagrams Software provides the unique Cloud Computing Diagrams solution from the Computers and Network area of ConceptDraw Solution Park with wide set of powerful tools for fast and easy creating various types of Architecture diagrams.

Block Diagram

The vector stencils libraries: Block Diagrams, Blocks with Perspective, Callouts, Connectors, Raised Blocks from the solution Block Diagrams contain specific block diagram symbols such as arrows, input/output symbols, start/end symbols, processing symbols, conditional symbols, commenting symbols, callouts, connectors, etc. for ConceptDraw DIAGRAM diagramming and vector drawing software. The Block Diagrams solution is contained in a "Diagrams" area of ConceptDraw Solution Park.
Use the libraries from the Block Diagrams solution to draw block diagrams for your business documents, presentations and websites in a few minutes.

ER Diagram for Cloud Computing

The entity–relationship (ER) model is a data model that lets graphically represent the information system and depict the relationships between people, objects, concepts, places, and events within a given system. It is also convenient to use the ER Diagram for Cloud computing representation and description the Cloud computing architecture, design them with pleasure using the extensive tools of the Cloud Computing Diagrams solution from the Computers and Network area of ConceptDraw Solution Park.

flow chart software, flowchart maker, flowchart, flow chart Flowcharts

flow chart software, flowchart maker, flowchart, flow chart
The Flowcharts solution for ConceptDraw DIAGRAM is a comprehensive set of examples and samples in several varied color themes for professionals that need to represent graphically a process. Solution value is added by the basic flow chart template and shapes' libraries of flowchart notation. ConceptDraw DIAGRAM flow chart creator lets one depict the processes of any complexity and length, as well as design the Flowchart either vertically or horizontally.

audit flowchart, fiscal flowchart, audit steps, chart audits, chart auditor, auditing process, audit process flowchart, audit planning process Audit Flowcharts

audit flowchart, fiscal flowchart, audit steps, chart audits, chart auditor, auditing process, audit process flowchart, audit planning process
Audit flowcharts solution extends ConceptDraw DIAGRAM software with templates, samples and library of vector stencils for drawing the audit and fiscal flow charts.

cross-functional flowchart template, flowchart, example business process flow Cross-Functional Flowcharts

cross-functional flowchart template, flowchart, example business process flow
Cross-functional flowcharts are powerful and useful tool for visualizing and analyzing complex business processes which requires involvement of multiple people, teams or even departments. They let clearly represent a sequence of the process steps, the order of operations, relationships between processes and responsible functional units (such as departments or positions).

sales process map, sales process flowchart, sales steps, sales process management Sales Flowcharts

sales process map, sales process flowchart, sales steps, sales process management
The Sales Flowcharts solution lets you create and display sales process maps, sales process workflows, sales steps, the sales process, and anything else involving sales process management.

accounting flowchart, accounting cycle, what is the accounting cycle, accounts payable process flow chart, accounts payable flowchart, steps of accounting cycle, accounting flowchart Accounting Flowcharts

accounting flowchart, accounting cycle, what is the accounting cycle, accounts payable process flow chart, accounts payable flowchart, steps of accounting cycle, accounting flowchart
Accounting Flowcharts solution extends ConceptDraw DIAGRAM software with templates, samples and library of vector stencils for drawing the accounting flow charts.