Process Flow Diagram

Basic Diagramming


Value-Stream Mapping for Manufacturing
")
Flow chart Example. Warehouse Flowchart


Value Stream Mapping for the Lean Office
")
Quality Engineering Diagrams
 sample")
The vector stencils library "Workflow diagrams" contains 54 symbol icons of workflow diagrams.
Use these clipart to represent information flow, automation of business processes, business process re-engineering, accounting, management, and human resources tasks in industry, business, and manufacturing.
"The term workflow is more commonly used in particular industries, such as printing and professional domains, where it may have particular specialized meanings.
(1) Processes: A process is a more general notion than workflow and can apply to physical or biological processes, for instance; whereas a workflow is typically a process or collection of processes described in the context of work, such as all processes occurring in a machine shop.
(2) Planning and scheduling: A plan is a description of the logically necessary, partially ordered set of activities required to accomplish a specific goal given certain starting conditions. A plan, when augmented with a schedule and resource allocation calculations, completely defines a particular instance of systematic processing in pursuit of a goal. A workflow may be viewed as an (often optimal or near-optimal) realization of the mechanisms required to execute the same plan repeatedly.
(3) Flow control is a control concept applied to workflows, to distinguish from static control of buffers of material or orders, to mean a more dynamic control of flow speed and flow volumes in motion and in process. Such orientation to dynamic aspects is the basic foundation to prepare for more advanced job shop controls, such as just-in-time or just-in-sequence.
(4) In-transit visibility is a monitoring concept that applies to transported material as well as to work in process or work in progress, i.e., workflows." [Workflow. Wikipedia]
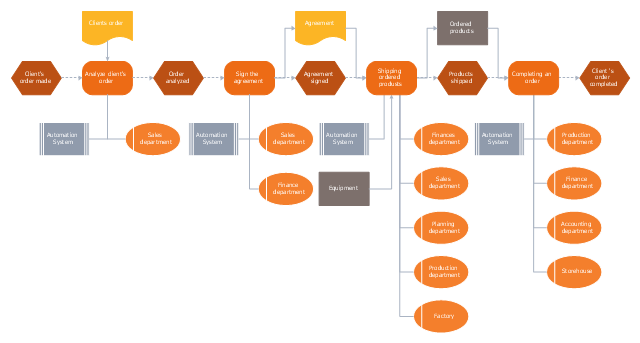
The example "Workflow diagram - Business" was drawn using the ConceptDraw PRO diagramming and vector drawing software extended with the Workflow Diagrams solution from the Business Processes area of ConceptDraw Solution Park.
Use these clipart to represent information flow, automation of business processes, business process re-engineering, accounting, management, and human resources tasks in industry, business, and manufacturing.
"The term workflow is more commonly used in particular industries, such as printing and professional domains, where it may have particular specialized meanings.
(1) Processes: A process is a more general notion than workflow and can apply to physical or biological processes, for instance; whereas a workflow is typically a process or collection of processes described in the context of work, such as all processes occurring in a machine shop.
(2) Planning and scheduling: A plan is a description of the logically necessary, partially ordered set of activities required to accomplish a specific goal given certain starting conditions. A plan, when augmented with a schedule and resource allocation calculations, completely defines a particular instance of systematic processing in pursuit of a goal. A workflow may be viewed as an (often optimal or near-optimal) realization of the mechanisms required to execute the same plan repeatedly.
(3) Flow control is a control concept applied to workflows, to distinguish from static control of buffers of material or orders, to mean a more dynamic control of flow speed and flow volumes in motion and in process. Such orientation to dynamic aspects is the basic foundation to prepare for more advanced job shop controls, such as just-in-time or just-in-sequence.
(4) In-transit visibility is a monitoring concept that applies to transported material as well as to work in process or work in progress, i.e., workflows." [Workflow. Wikipedia]
The example "Workflow diagram - Business" was drawn using the ConceptDraw PRO diagramming and vector drawing software extended with the Workflow Diagrams solution from the Business Processes area of ConceptDraw Solution Park.
Business - Work flow chart

Create a Flow Chart

Contoh Flowchart

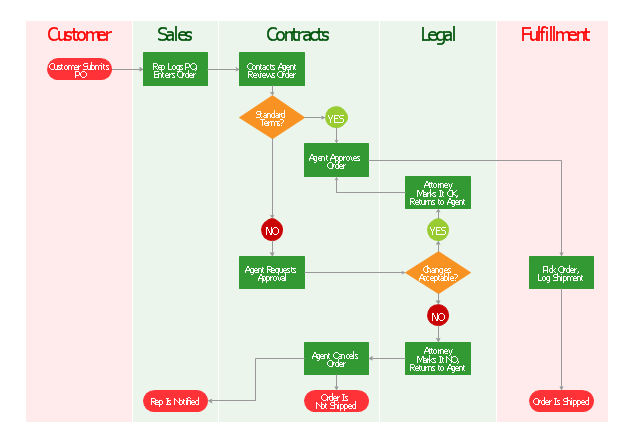
"Order processing is a key element of Order fulfillment. Order processing operations or facilities are commonly called "distribution centers". "Order processing" is the term generally used to describe the process or the work flow associated with the picking, packing and delivery of the packed item(s) to a shipping carrier. The specific "order fulfillment process" or the operational procedures of distribution centers are determined by many factors. Each distribution center has its own unique requirements or priorities." [Order processing. Wikipedia]
The vertical cross-functional flow chart example "Order processing" was created using the ConceptDraw PRO diagramming and vector drawing software extended with the Flowcharts solution from the area "What is a Diagram" of ConceptDraw Solution Park.
The vertical cross-functional flow chart example "Order processing" was created using the ConceptDraw PRO diagramming and vector drawing software extended with the Flowcharts solution from the area "What is a Diagram" of ConceptDraw Solution Park.
Cross-functional flowchart
Building Drawing Design Element: Shipping and Receiving


"Order processing is a key element of Order fulfillment. Order processing operations or facilities are commonly called "distribution centers". "Order processing" is the term generally used to describe the process or the work flow associated with the picking, packing and delivery of the packed item(s) to a shipping carrier. The specific "order fulfillment process" or the operational procedures of distribution centers are determined by many factors. Each distribution center has its own unique requirements or priorities. There is no "one size fits all" process that universally provides the most efficient operation." [Order processing. Wikipedia]
The business process modeling (BPM) flowchart example "Order processing - EPC flow chart" was created using the ConceptDraw PRO diagramming and vector drawing software extended with the Event-driven Process Chain Diagrams solution from the Business Processes area of ConceptDraw Solution Park.
The business process modeling (BPM) flowchart example "Order processing - EPC flow chart" was created using the ConceptDraw PRO diagramming and vector drawing software extended with the Event-driven Process Chain Diagrams solution from the Business Processes area of ConceptDraw Solution Park.
EPC flow chart
Value Stream Mapping Template

Value Stream Mapping Symbols

- Shipping Process Flowchart
- Shipping Flowchart
- Shipping And Logistics Flow Chart Process
- Ocean Shipping Process Flow Chart
- Basic Diagramming | Process Flow Diagram | Business - Workflow ...
- Shipping And Receiving Process Flowchart Symbols
- Process Flow Diagram | Flow chart Example. Warehouse Flowchart ...
- Shipping And Receiving Process Flowchart
- Shipping Process Flow Chart Download
- Shipping Procedure Flow Chart
- Basic Diagramming | Process Flow Diagram | Flow chart Example ...
- Process Flow Diagram | Basic Diagramming | Flow chart Example ...
- Process Flowchart | Building Drawing Design Element: Shipping ...
- Order processing - Cross-functional flowchart | Order processing ...
- Shipping Flow Chart Examples
- Carrier Shipping Documents Process Flow Chart
- Basic Diagramming | Flow chart Example. Warehouse Flowchart ...
- Order processing - Cross-functional flowchart | Ordering Process ...
- Shipping Flow Chart