Basic Diagramming


Process Flow Chart Symbol

Data Flow Diagram

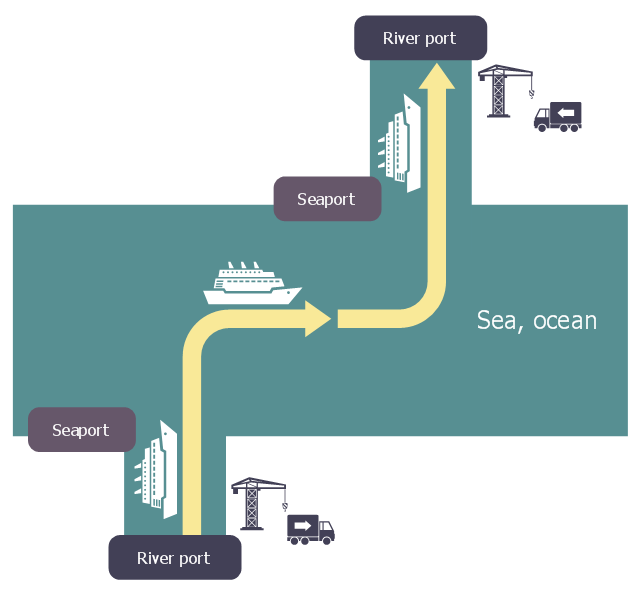
This logistic flow chart sample shows a chain of intermodal transport to link fluvio-maritime.
It was designed on the base of the Wikimedia Commons file: Logistique fluvio-maritime.jpg.
[commons.wikimedia.org/ wiki/ File:Logistique_ fluvio-maritime.jpg]
This file is licensed under the Creative Commons Attribution-Share Alike 3.0 Unported license. [creativecommons.org/ licenses/ by-sa/ 3.0/ deed.en]
"Intermodal freight transport involves the transportation of freight in an intermodal container or vehicle, using multiple modes of transportation (rail, ship, and truck), without any handling of the freight itself when changing modes. The method reduces cargo handling, and so improves security, reduces damage and loss, and allows freight to be transported faster. Reduced costs over road trucking is the key benefit for inter-continental use. This may be offset by reduced timings for road transport over shorter distances." [Intermodal freight transport. Wikipedia]
The logistic flowchart example "Intermodal transport chain" was created using ConceptDraw PRO diagramming and vector drawing software extended with the Logistics Flow Charts solution from the Business Processes area of ConceptDraw Solution Park.
Logistic flowchart
Professional Diagram and Flowchart Software

Accounting Flowchart Purchasing Receiving Payable and Payment

Data Flow Diagram Example

The vector stencils library "Workflow diagrams" contains 54 symbol icons of workflow diagrams.
Use these clipart to represent information flow, automation of business processes, business process re-engineering, accounting, management, and human resources tasks in industry, business, and manufacturing.
"The term workflow is more commonly used in particular industries, such as printing and professional domains, where it may have particular specialized meanings.
(1) Processes: A process is a more general notion than workflow and can apply to physical or biological processes, for instance; whereas a workflow is typically a process or collection of processes described in the context of work, such as all processes occurring in a machine shop.
(2) Planning and scheduling: A plan is a description of the logically necessary, partially ordered set of activities required to accomplish a specific goal given certain starting conditions. A plan, when augmented with a schedule and resource allocation calculations, completely defines a particular instance of systematic processing in pursuit of a goal. A workflow may be viewed as an (often optimal or near-optimal) realization of the mechanisms required to execute the same plan repeatedly.
(3) Flow control is a control concept applied to workflows, to distinguish from static control of buffers of material or orders, to mean a more dynamic control of flow speed and flow volumes in motion and in process. Such orientation to dynamic aspects is the basic foundation to prepare for more advanced job shop controls, such as just-in-time or just-in-sequence.
(4) In-transit visibility is a monitoring concept that applies to transported material as well as to work in process or work in progress, i.e., workflows." [Workflow. Wikipedia]
The example "Workflow diagram - Business" was drawn using the ConceptDraw PRO diagramming and vector drawing software extended with the Workflow Diagrams solution from the Business Processes area of ConceptDraw Solution Park.
Business - Work flow chart

Example of DFD for Online Store (Data Flow Diagram)


- Logistic Shipping Flow Chart
- Shipping Process Flow Chart
- Shipping And Logistics Flow Chart Process
- Shipping Process Flowchart
- Shipping Procedure Flow Chart
- Shipping , receiving and storage | Flow chart Example. Warehouse ...
- Shipping And Receiving Process Flowchart
- Packing And Shipping Flowchart
- Online Shopping Export Shipping Flowchart
- Shipping And Receiving Process Flowchart Symbols