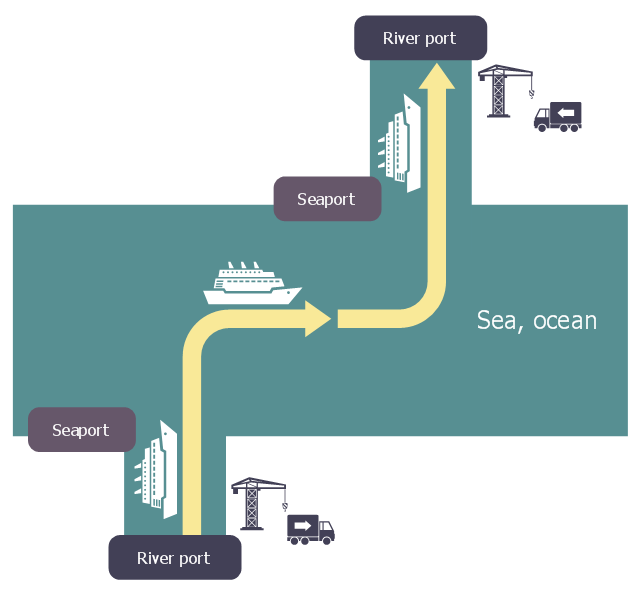
This logistic flow chart sample shows a chain of intermodal transport to link fluvio-maritime.
It was designed on the base of the Wikimedia Commons file: Logistique fluvio-maritime.jpg.
[commons.wikimedia.org/ wiki/ File:Logistique_ fluvio-maritime.jpg]
This file is licensed under the Creative Commons Attribution-Share Alike 3.0 Unported license. [creativecommons.org/ licenses/ by-sa/ 3.0/ deed.en]
"Intermodal freight transport involves the transportation of freight in an intermodal container or vehicle, using multiple modes of transportation (rail, ship, and truck), without any handling of the freight itself when changing modes. The method reduces cargo handling, and so improves security, reduces damage and loss, and allows freight to be transported faster. Reduced costs over road trucking is the key benefit for inter-continental use. This may be offset by reduced timings for road transport over shorter distances." [Intermodal freight transport. Wikipedia]
The logistic flowchart example "Intermodal transport chain" was created using ConceptDraw PRO diagramming and vector drawing software extended with the Logistics Flow Charts solution from the Business Processes area of ConceptDraw Solution Park.
Logistic flowchart
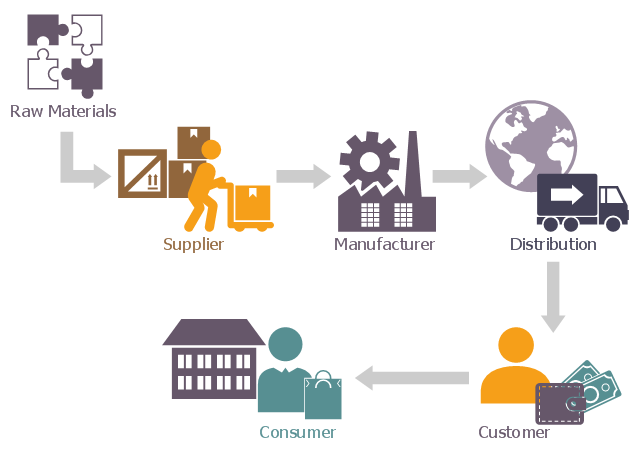
This basic diagram of supply chain network showing the movement of goods from the raw materials stage into the hands of the end consumer.
It was designed on the base of the Wikimedia Commons file: Supply chain network.png. [commons.wikimedia.org/ wiki/ File:Supply_ chain_ network.png]
This file is licensed under the Creative Commons Attribution-Share Alike 4.0 International license. [creativecommons.org/ licenses/ by-sa/ 4.0/ deed.en]
"A supply chain is a system of activities involved in handling, distributing, manufacturing and processing goods in order to move resources from a vendor into the hands of the final consumer. A supply chain is a complex network of interconnected players governed by supply and demand." [Supply chain attack. Wikipedia]
The logistic flowchart example "Supply chain network" was created using ConceptDraw PRO diagramming and vector drawing software extended with the Logistics Flow Charts solution from the Business Processes area of ConceptDraw Solution Park.
Logistic flowchart
 Logistics Flow Charts
Logistics Flow Charts solution extends ConceptDraw PRO v11 functionality with opportunities of powerful logistics management software. It provides large collection of predesigned vector logistic symbols, pictograms, objects and clipart to help you design with pleasure Logistics flow chart, Logistics process flow diagram, Inventory flow chart, Warehouse flowchart, Warehouse management flow chart, Inventory control flowchart, or any other Logistics diagram. Use this solution for logistics planning, to reflect logistics activities and processes of an enterprise or firm, to depict the company's supply chains, to demonstrate the ways of enhancing the economic stability on the market, to realize logistics reforms and effective products' promotion.
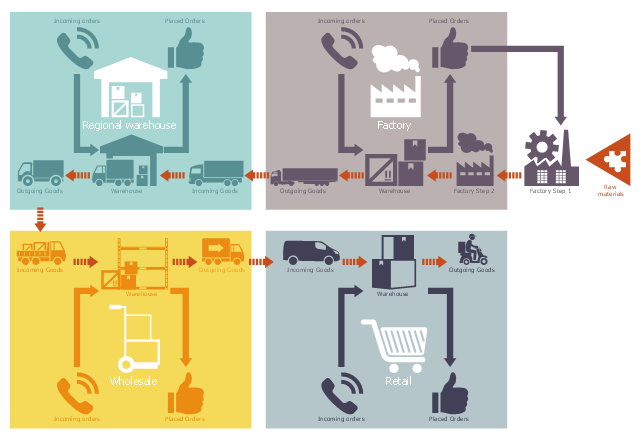
The vector stencils library "Logistic warehouse" contains 30 workflow icons.
Use it to draw your logistic flowcharts and workflow diagrams in ConceptDraw PRO diagramming and vector drawing software.
The workflow icons example "Design elements - Logistic warehouse" is included in the Logistics Flow Charts solution from the Business Processes area of ConceptDraw Solution Park.
Workflow icons
 Cross-Functional Flowcharts
Cross-functional flowcharts are powerful and useful tool for visualizing and analyzing complex business processes which requires involvement of multiple people, teams or even departments. They let clearly represent a sequence of the process steps, the order of operations, relationships between processes and responsible functional units (such as departments or positions).
This logistic flow chart sample shows a board design for the beer distribution game.
It was designed on the base of the Wikimedia Commons file: Beer Distribution Game Board.JPG. [commons.wikimedia.org/ wiki/ File:Beer_ Distribution_ Game_ Board.JPG]
This file is licensed under the Creative Commons Attribution-Share Alike 3.0 Unported license. [creativecommons.org/ licenses/ by-sa/ 3.0/ deed.en]
"The beer distribution game (also known as the beer game) is an experiential learning business simulation game created by a group of professors at MIT Sloan School of Management in early 1960s to demonstrate a number of key principles of supply chain management. The game is played by teams of at least four players, often in heated competition, and takes at least one hour to complete. A debriefing session of roughly equivalent length typically follows to review the results of each team and discuss the lessons involved.
The purpose of the game is to understand the distribution side dynamics of a multi-echelon supply chain used to distribute a single item, in this case, cases of beer." [Beer distribution game. Wikipedia]
The logistic flowchart example "Beer distribution game" was created using ConceptDraw PRO diagramming and vector drawing software extended with the Logistics Flow Charts solution from the Business Processes area of ConceptDraw Solution Park.
Logistic flowchart
"Value Stream Mapping (VSM):
– Special type of flow chart that uses symbols known as "the language of Lean" to depict and improve the flow of inventory information. ...
Value Stream Mapping ...
Provide optimum value to the customer through a complete value creation process with minimum waste in:
– Design (concept to customer);
– Design (concept to customer);
– Build (order to delivery);
– Sustain (in-use through life cycle to service)." [courses.washington.edu/ ie337/ Value_ Stream_ Mapping.pdf]
This sample Value Stream Map shows how customer value is created in the steps of manufacturing, production control, and shipping processes.
This VSM example was created using the ConceptDraw PRO diagramming and vector drawing software extended with the Value Stream Mapping solution from the Quality area of ConceptDraw Solution Park.
Value stream mapping

- Shipping And Logistics Flow Chart Process
- Logistics Flow Charts | Diagram Of Partners Ship Firm
- Flow chart Example. Warehouse Flowchart | Contoh Flowchart ...
- Shipping And Logistics Process Flow Chart
- Ocean Shipping Process Flow Chart
- Logistics Flow Charts | Intermodal transport chain | Design Data ...
- Logistics Delivery Shipping Flowchart
- Logistics Flow Charts | Road Transport - Design Elements ...
- Logistics Flow Charts | UML Class Diagram Example for Transport ...