Purchasing Flow Chart. Purchasing Flowchart Example
This sample shows the Purchasing Flow Chart Diagram that displays the money flow in the carbon offset sphere. The carbon offsets are the compensatory measures that the companies make for the carbon emissions. You can see on this sample the groups that have interests in the carbon offsets and the money flow after the carbon offset vendors sold the carbon offsets.Basic Audit Flowchart. Flowchart Examples
This sample shows the Audit Process Flowchart. It was created in ConceptDraw PRO diagramming and vector drawing software using the Flowcharts solution from the What is a Diagram area of ConceptDraw Solution Park. The Audit Flowcharts are widely used in the financial management, accounting, money management and in many others fields.Audit Process Flowchart. Audit Flowchart
Audit Process Flowchart, Audit Flowchart - Audit Flowcharts solution for ConceptDraw PRO Solution Park provides the Audit Flowcharts library with wide variety of predesigned audit flowchart symbols, and also the set of templates and samples allowing you design your own audit flowchart or audit process flowchart in one moment. Simply use any of offered samples and change it for your needs, or fill the desired template.Audit Steps
Audit Steps - The auditing process is an independent examination of data, statements, operations, records, financial or otherwise performances of an enterprise for any stated purpose. It is a complex process that includes 10 audit steps: Notification, Planning, Opening Meeting, Fieldwork, Communication, Draft Audit, Management Response, Final Meeting, Report Distribution, Feedback.How to Make an Accounting Process Flowchart
Tips on how to make an accounting flowchart. Describing methods and symbols that are used to represent the accounting system.Sales Process Flowchart Symbols
The most easier way of creating the visually engaging and informative Sales Process Flowchart is to create the new ConceptDraw document and to use the predesigned vector symbols offered in 6 libraries of the Sales Flowchart Solution. There are more than six types of sales process flow diagrams, ConceptDraw PRO software is flowchart maker which include six collections of extended flowchart symbols for effective diagramming. There are main collections of color coded flowchart symbols: Sales Department, Sales Steps, Sales Workflow, Sales Symbols and special set of Sales Arrows and Sales Flowchart.Process Flow Chart Symbol
Process Flow Charts are very popular and widely used in chemical and process engineering for representation a general flow of plant processes and equipment. If you need often draw them, the ConceptDraw PRO diagramming and vector drawing software extended with tools of Flowcharts Solution will be useful for you. The mostly used set of process flow chart symbols includes the following: Rectangle (box) process flow chart symbol, Rounded rectangle, Circle, Diamond.Pie Donut Chart. Pie Chart Examples
This sample shows the Pie Donut Chart. It was created in ConceptDraw PRO diagramming and vector drawing software using the ready-to-use object from the Pie Charts Solution from Graphs and Charts area of ConceptDraw Solution Park. The Pie Donut Chart visualizes the percentage of parts of the whole and looks like as a ring divided into sectors. Pie Donut Charts are widely used in the business, statistics, analytics, mass media.Internal Audit Process
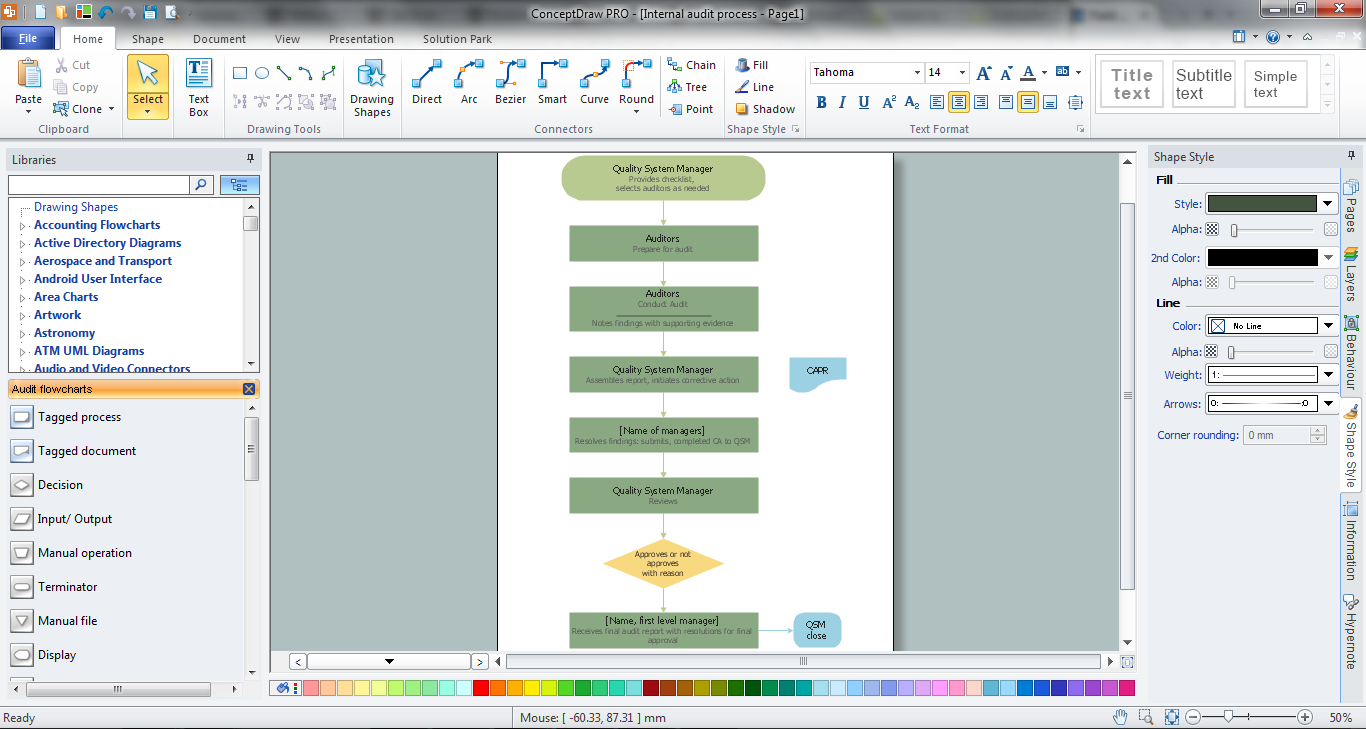
Internal auditing is an independent, objective assurance and consulting activity designed to add value and improve an organization's operations. ConceptDraw PRO diagramming and vector drawing software extended with Audit Flowcharts solution from the Finance and Accounting area perfectly suits for the Internal Audit Process. You can make sure this right now!Audit Procedures
Audit procedures are the specific tests and methods that auditor executes when gathering the evidence which are necessary for making an opinion on the financial statements of the firm. There are three types of audit procedures: data selection, reliability validation, relevance confirmation. Thanks to the extensive drawing tools which provides the Audit Flowcharts solution from the Finance and Accounting area of ConceptDraw Solution Park, you can easy and effectively develop and realize various audit procedures.Definition Flowchart
A flowchart is a type of diagram that represents an algorithm, workflow or process, showing the steps as boxes of various kinds, and their order by connecting them with arrows. This definition flowchart gives a clear answer for the question "What is a flowchart?". It is convenient to use a powerful ConceptDraw PRO software extended with Flowcharts Solution from the "What is a Diagram" Area of ConceptDraw Solution Park to design flowcharts of various types which will additionally illustrate a definition flowchart.Auditing Process. Audit Planning Process
Auditing Process, Audit Planning Process - The audit is complex process of independent examination of data, statements, operations, financial performances of an enterprise for a stated purpose. The auditing process consists of defined quantity of audit steps. Planning is fundamental stage of auditing process. The carefully thought-out audit planning process ensures the success of the business project.Bar Diagrams for Problem Solving. Create manufacturing and economics bar charts with Bar Graphs Solution
Create bar charts for visualizing problem solving in manufacturing and economics using the ConceptDraw PRO diagramming and vector drawing software extended with the Bar Graphs Solution from the Graphs and Charts area of ConceptDraw Solition Park.Flowchart on Bank. Flowchart Examples
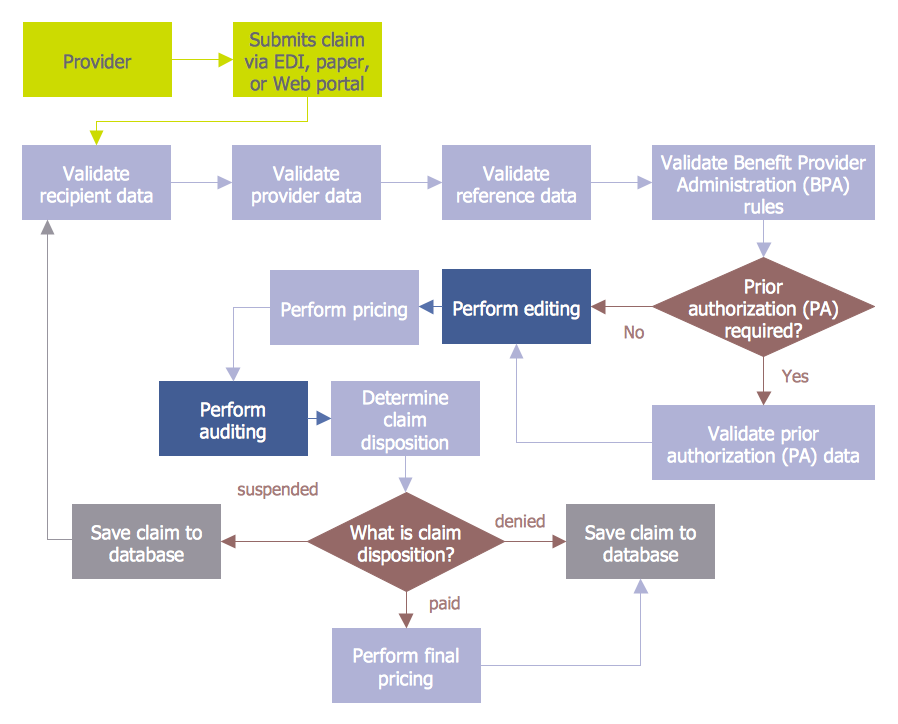
This sample was created in ConceptDraw PRO diagramming and vector drawing software using the Flowcharts solution from the What is a Diagram area of ConceptDraw Solution Park. This sample shows the Flowchart of the Subprime Mortgage Crisis. This Flowchart describes the decline in housing prices when the housing bubble burst and what it caused on the housing and financial markets. You can also see the Government and Industry responses in this crisis situation.
- Financing And Investing Cycle Flowchart
- Financial Flow Chart Examples
- Process Flowchart | Audit Steps | What is the Accounting Cycle ...
- Circular Flow Diagram Template | Draw Flowcharts with ...
- Process Flowchart | Design elements - Workflow finance | Basic ...
- Process Flowchart | Marketing Diagrams | Relative Value Chart ...
- Investing Cycle For Flowchart
- Program to Make Flow Chart | Draw Flowcharts with ConceptDraw ...
- Strategic planning - Cycle diagram | Basic Flowchart Symbols and ...
- Grant life cycle - Arrow ring diagram | Flow chart Example ...
- Steps of Accounting Cycle | Steps in the Accounting Process | What ...
- Target and Circular Diagrams | Target Diagram | Circular Flow ...
- Product life cycle graph - Template | Circular Flow Diagram ...
- Process Flowchart | Sales Process Flowchart . Flowchart Examples ...
- Program to Make Flow Chart | Basic Diagramming | Circular Flow ...
- Community life cycle matrix - Ring chart | Process Flowchart | Flow ...
- Financial Comparison Chart | Bar Diagrams for Problem Solving ...
- PDCA cycle | Project management - Vector stencils library ...
- Circular Flow Diagram Template | Matrices | Basic Diagramming ...
- Accounting Flowchart Symbols | Sales Growth. Bar Graphs Example ...


