Venn Diagram Examples for Problem Solving. Computer Science. Chomsky Hierarchy

Venn Diagram Examples for Problem Solving. Venn Diagram as a Truth Table

FSM — Finite-state Machine

Object-Oriented Development (OOD) Method
 Method *")
Mathematical Diagrams

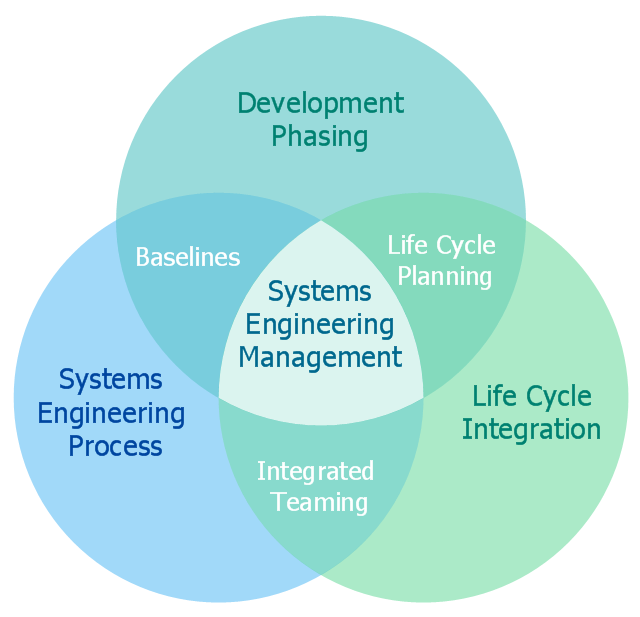
This Venn diagram sample shows the systems engineering activities. It was designed on the base of the Wikimedia Commons file: SE Activities.jpg. [commons.wikimedia.org/ wiki/ File:SE_ Activities.jpg]
"Systems engineering is an interdisciplinary field of engineering that focuses on how to design and manage complex engineering systems over their life cycles. At its core systems engineering utilizes systems thinking principles to organize this body knowledge. Issues such as requirements engineering, reliability, logistics, coordination of different teams, testing and evaluation, maintainability and many other disciplines necessary for successful system development, design, implementation, and ultimate decommission become more difficult when dealing with large or complex projects. Systems engineering deals with work-processes, optimization methods, and risk management tools in such projects. It overlaps technical and human-centered disciplines such as industrial engineering, manufacturing engineering, control engineering, software engineering, electrical engineering, cybernetics, organizational studies, and project management. Systems engineering ensures that all likely aspects of a project or system are considered, and integrated into a whole." [Systems engineering. Wikipedia]
The Venn diagram example "Systems engineering activities" was created using ConceptDraw DIAGRAM software extended with Business Diagrams solution from Management area of ConceptDraw Solution Park.
Venn diagram
Venn Diagram Template

Bar Diagrams for Problem Solving. Create business management bar charts with Bar Graphs Solution

Basic Circles Venn Diagram. Venn Diagram Example

Improving Problem Solving and Focus with Fishbone Diagrams

Making Mechanical Diagram

HR Flowchart Symbols

Bar Diagrams for Problem Solving. Create manufacturing and economics bar charts with Bar Graphs Solution

Sentence Diagram

Simple Flow Chart

Flow Chart Creator

Cross Functional Flowchart for Business Process Mapping

Entity Relationship Diagram Software Engineering

TQM Diagram Example

Basic Flowchart Examples

- Venn Diagrams | Chemical and Process Engineering | Venn ...
- Systems engineering improvement | Venn Diagrams | Chemical and ...
- Venn Diagram Examples for Problem Solving . Venn Diagram as a ...
- Venn Diagram Examples For Engineers
- Chemical Engineering | SWOT and TOWS Matrix Diagrams | Venn ...
- Venn Diagram Examples for Problem Solving . Venn Diagram as a ...
- Chemical and Process Engineering | Venn Diagram Examples for ...
- Venn Diagram Examples for Problem Solving . Computer Science ...
- Venn Diagram Examples for Problem Solving
- Problem Solution Map Examples
- Chart Showing The Problem And Solution In Engineering
- Venn Diagram Examples for Problem Solving . Computer Science ...
- Wiring Diagrams with ConceptDraw DIAGRAM | Electrical ...
- Root cause analysis tree diagram - Manufacturing problem solution ...
- Venn Diagram Examples for Problem Solving . Environmental Social ...
- Chemical and Process Engineering | Venn Diagram Examples for ...
- How To Draw A Vector Diagram Engineering Science
- Venn Diagram Examples for Problem Solving . Environmental Social ...
- Entity Relationship Diagram Software Engineering | Components of ...
- Venn Diagrams | Systems engineering improvement | Chemical and ...