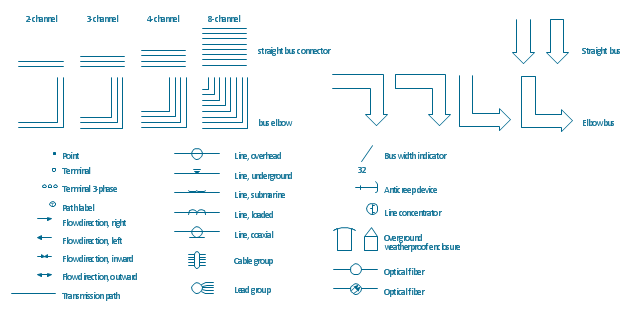
The vector stencils library "Transmission paths" contains 43 symbols of power transmission paths, electronic circuits, bus connectors and elbows, terminals, junctions, and concentrators.
Use it to annotate electrical diagrams, electronic schematics and circuit diagrams.
"A physical medium in data communications is the transmission path over which a signal propagates.
Many transmission media are used as communications channel.
For telecommunications purposes in the United States, Federal Standard 1037C, transmission media are classified as one of the following:
(1) Guided (or bounded) - waves are guided along a solid medium such as a transmission line.
(2) Wireless (or unguided) - transmission and reception are achieved by means of an antenna.
One of the most common physical medias used in networking is copper wire. Copper wire to carry signals to long distances using relatively low amounts of power. The unshielded twisted pair (UTP) is eight strands of copper wire, organized into four pairs.
Another example of a physical medium is optical fiber, which has emerged as the most commonly used transmission medium for long-distance communications. Optical fiber is a thin strand of glass that guides light along its length.
Multimode and single mode are two types of commonly used optical fiber. Multimode fiber uses LEDs as the light source and can carry signals over shorter distances, about 2 kilometers. Single mode can carry signals over distances of tens of miles.
Wireless media may carry surface waves or skywaves, either longitudinally or transversely, and are so classified.
In both communications, communication is in the form of electromagnetic waves. With guided transmission media, the waves are guided along a physical path; examples of guided media include phone lines, twisted pair cables, coaxial cables, and optical fibers. Unguided transmission media are methods that allow the transmission of data without the use of physical means to define the path it takes. Examples of this include microwave, radio or infrared. Unguided media provide a means for transmitting electromagnetic waves but do not guide them; examples are propagation through air, vacuum and seawater.
The term direct link is used to refer to the transmission path between two devices in which signals propagate directly from transmitters to receivers with no intermediate devices, other than amplifiers or repeaters used to increase signal strength. This term can apply to both guided and unguided media.
A transmission may be simplex, half-duplex, or full-duplex.
In simplex transmission, signals are transmitted in only one direction; one station is a transmitter and the other is the receiver. In the half-duplex operation, both stations may transmit, but only one at a time. In full duplex operation, both stations may transmit simultaneously. In the latter case, the medium is carrying signals in both directions at same time." [Transmission medium. Wikipedia]
The shapes example "Design elements - Transmission paths" was drawn using the ConceptDraw PRO diagramming and vector drawing software extended with the Electrical Engineering solution from the Engineering area of ConceptDraw Solution Park.
Transmission path symbols
Basic Flowchart Symbols and Meaning


The vector stencils library "Periodic table of chemical elements" contains 119 icon symbols of chemical elements for drawing Mendeleev's periodic table, chemical diagrams, infographics and illustrations.
"A chemical element is a pure chemical substance consisting of a single type of atom distinguished by its atomic number, which is the number of protons in its atomic nucleus. Elements are divided into metals, metalloids, and non-metals. Familiar examples of elements are carbon, nitrogen, oxygen (non-metals), silicon, arsenic (metalloids), aluminium, iron, copper, gold, mercury, and lead (metals).
The lightest chemical elements, including hydrogen, helium and smaller amounts of lithium, beryllium and boron, are thought to have been produced by various cosmic processes during the Big Bang and cosmic-ray spallation. Production of heavier elements, from carbon to the very heaviest elements, proceeded by stellar nucleosynthesis, and these were made available for later solar system and planetary formation by planetary nebulae and supernovae, which blast these elements into space. The high abundance of oxygen, silicon, and iron on Earth reflects their common production in such stars. While most elements are generally stable, a small amount of natural transformation of one element to another also occurs in the decay of radioactive elements as well as other natural nuclear processes." [Chemical element. Wikipedia]
The chemical symbols example "Design elements - Periodic table of chemical elements" was created using the ConceptDraw PRO software extended with the Chemistry solution from the Science and Education area of ConceptDraw Solution Park.
Mendeleev periodic table icons
UML Deployment Diagram. Design Elements

UML Class Diagram Generalization Example UML Diagrams

UML Use Case Diagram. Design Elements
")

Building Drawing Design Element Site Plan


Design Element: Computer and Network for Network Diagrams
.png "Network Diagramming Tools, Design Elements - Computer and Network (Win Mac)")

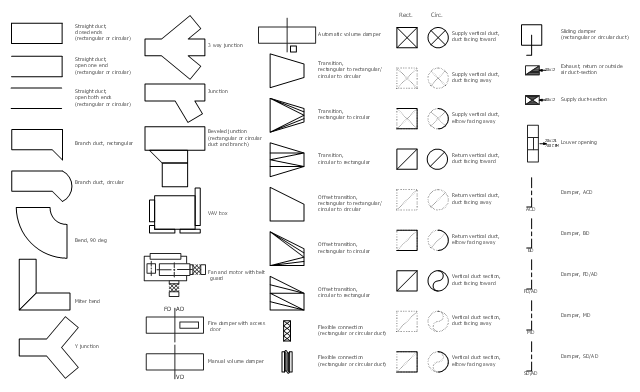
The vector stencils library "HVAC ductwork" contains 55 ducts, vents and HVAC mechanical components symbols.
Use the design elements library "HVAC ductwork" for drawing the HVAC ductwork system diagrams, heating, ventilation, air conditioning, refrigeration, automated building control and environmental control system layout floor plans.
"Ducts are used in heating, ventilation, and air conditioning (HVAC) to deliver and remove air. These needed airflows include, for example, supply air, return air, and exhaust air. Ducts also deliver, most commonly as part of the supply air, ventilation air. As such, air ducts are one method of ensuring acceptable indoor air quality as well as thermal comfort.
A duct system is often called ductwork. Planning ('laying out'), sizing, optimizing, detailing, and finding the pressure losses through a duct system is called duct design." [Duct (HVAC). Wikipedia]
The shapes library "HVAC ductwork" is included in the HVAC Plans solution from the Building Plans area of ConceptDraw Solution Park.
HVAC ductwork symbols
Marketing Plan Infographic

"A chart can take a large variety of forms, however there are common features that provide the chart with its ability to extract meaning from data.
Typically the data in a chart is represented graphically, since humans are generally able to infer meaning from pictures quicker than from text. Text is generally used only to annotate the data.
One of the more important uses of text in a graph is the title. A graph's title usually appears above the main graphic and provides a succinct description of what the data in the graph refers to.
Dimensions in the data are often displayed on axes. If a horizontal and a vertical axis are used, they are usually referred to as the x-axis and y-axis respectively. Each axis will have a scale, denoted by periodic graduations and usually accompanied by numerical or categorical indications. Each axis will typically also have a label displayed outside or beside it, briefly describing the dimension represented. If the scale is numerical, the label will often be suffixed with the unit of that scale in parentheses. ...
Within the graph a grid of lines may appear to aid in the visual alignment of data. The grid can be enhanced by visually emphasizing the lines at regular or significant graduations. The emphasized lines are then called major grid lines and the remainder are minor grid lines.
The data of a chart can appear in all manner of formats, and may include individual textual labels describing the datum associated with the indicated position in the chart. The data may appear as dots or shapes, connected or unconnected, and in any combination of colors and patterns. Inferences or points of interest can be overlaid directly on the graph to further aid information extraction.
When the data appearing in a chart contains multiple variables, the chart may include a legend (also known as a key). A legend contains a list of the variables appearing in the chart and an example of their appearance. This information allows the data from each variable to be identified in the chart." [Chart. Wikipedia]
The vector stencils library "Time series charts" contains 10 templates: 3 column charts, 3 bar charts, 2 line graphs and 2 dot plots. All these charts are Live Objects displaying the data from external data source files.
Use these chart templates to design your business performance digital dashboards using the ConceptDraw PRO diagramming and vector drawing software.
The example "Design elements - Time series charts" is included in the Time Series Dashboard solution from the area "What is a Dashboard" of ConceptDraw Solution Park.
Time series charts

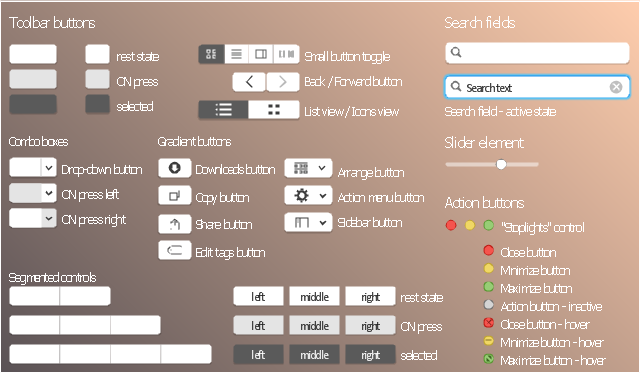
The vector stencils library "Toolbar control elements" contains 42 toolbar graphical control elements.
Use this toolbar control element UI icon set to design graphic user interface (GUI) of your software application for OS X 10.10 Yosemite Apple Mac operating system.
"A graphical control element or widget is an element of interaction in a graphical user interface (GUI), such as a button or a scroll bar. Controls are software components that a computer user interacts with through direct manipulation to read or edit information about an application. ...
Each widget facilitates a specific type of user-computer interaction, and appears as a visible part of the application's GUI as defined by the theme and rendered by the rendering engine. The theme makes all graphical control elements adhere to a unified aesthetic design and creates a sense of overall cohesion. Some widgets support interaction with the user, for example labels, buttons, and check boxes. Others act as containers that group the widgets added to them, for example windows, panels, and tabs." [Graphical control element. Wikipedia]
The icons example "Design elements - Toolbar control elements" was created using the ConceptDraw PRO diagramming and vector drawing software extended with the Mac OS User Interface solution from the Software Development area of ConceptDraw Solution Park.
Toolbar graphical control elements
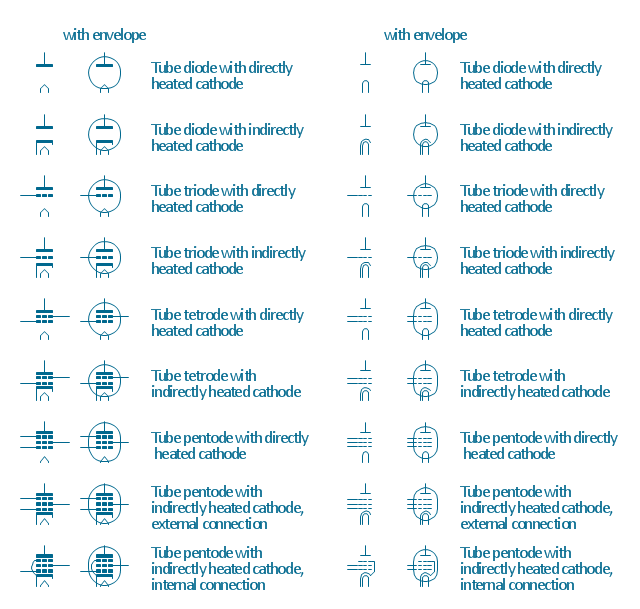
The vector stencils library "Design elements - Electron tubes" contains 36 element symbols of electron tubes.
Use it for drawing electrical schematics and electronic circuit diagrams.
"One classification of vacuum tubes is by the number of active electrodes, (neglecting the filament or heater). A device with two active elements is a diode, usually used for rectification. Devices with three elements are triodes used for amplification and switching. Additional electrodes create tetrodes, pentodes, and so forth, which have multiple additional functions made possible by the additional controllable electrodes.
Other classifications are:
(1) by frequency range (audio, radio, VHF, UHF, microwave),
(2) by power rating (small-signal, audio power, high-power radio transmitting),
(3) by design (e.g., sharp- versus remote-cutoff in some pentodes),
(4) by application (receiving tubes, transmitting tubes, amplifying or switching, rectification, mixing),
(5) special qualities (long life, very low microphonic and low noise audio amplification, and so on).
Multiple classifications may apply to a device; for example similar dual triodes can be used for audio preamplification and as flip-flops in computers, although linearity is important in the former case and long life in the latter.
Tubes have different functions, such as cathode ray tubes which create a beam of electrons for display purposes (such as the television picture tube) in addition to more specialized functions such as electron microscopy and electron beam lithography. X-ray tubes are also vacuum tubes. Phototubes and photomultipliers rely on electron flow through a vacuum, though in those cases electron emission from the cathode depends on energy from photons rather than thermionic emission." [Vacuum tube. Wikipedia]
The symbols example "Design elements - Electron tubes" was drawn using the ConceptDraw PRO diagramming and vector drawing software extended with the Electrical Engineering solution from the Engineering area of ConceptDraw Solution Park.
Vacuum tubes
Building Drawing Software for Design Office Layout Plan

- UML Deployment Diagram. Design Elements | UML Deployment ...
- Example Of Elements In Chemistry
- DFD Library - Design elements | Design Data Flow. DFD Library ...
- Design elements - TQM diagram | TQM diagram example | Total ...
- Wireless Network Elements | Network Diagramming Software for ...
- How To Share Presentation via Skype | Design elements - Periodic ...
- State Diagram Example - Online Store | Design elements - UML ...
- Design elements - Swimlanes BPMN 2.0 | Business Process ...
- Wide area network (WAN) topology. Computer and Network Examples
- UML Class Diagram Example for Transport System | Road Transport ...
- UML Component Diagram. Design Elements | UML Component ...
- An Example Of Lines As A Graphing Designing Element
- Flow chart Example . Warehouse Flowchart | Design elements ...
- UML Component Diagram Example - Online Shopping
- Telecommunication Network Diagrams | How to Create a ...
- Pie Chart Examples and Templates | Design elements ...
- Lighting and switch layout
- Design elements - Periodic table of chemical elements | Design ...
- Design elements - Office furniture | Design elements - Furniture ...
- Total Quality Management Definition | Design elements - TQM ...