Banquet Hall Plan Software

 Cross-Functional Flowcharts
The Cross-Functional Flowcharts solution extends ConceptDraw DIAGRAM software with cross functional flowchart examples, samples, and libraries of cross functional flow chart vector design elements and CH-1 symbols for easy drawing professional-looking and illustrative Cross Functional Flowchart, Cross Functional Diagram, CH-1 Diagram, Process Flowchart, Deployment Flowchart, Opportunity Flowchart, Swimlane Process Mapping Diagram, or Visio Cross Functional Flowchart for planning and further analyzing, optimizing and improvement processes. The use of included pre-made cross functional flowchart template, opportunity flowchart template, and swimlane process map template, greatly easier designing your Cross-functional flowcharts.
Bar Diagrams for Problem Solving. Create event management bar charts with Bar Graphs Solution

 Scatter Diagrams
The Scatter Diagrams solution extends ConceptDraw DIAGRAM functionality with templates, samples, and a library of vector stencils that make construction of a Scatter Plot easy. The Scatter Chart Solution makes it easy to design attractive Scatter Diagrams used in various fields of science, work, and life activities. ConceptDraw DIAGRAM lets you enter the data to the table and construct the Scatter Plot Graph automatically according to these data.
What is SWOT Analysis?

Hiring Process

 HR Dashboard
The HR Dashboard solution extends ConceptDraw DIAGRAM functionality with powerful drawing tools and great collection of comprehensive vector design elements, icons, pictograms and objects, navigation elements, live objects of HR charts, HR indicators, and thematic maps. The range of HR Dashboards applications is extensive, among them the human resource management, recruitment, hiring process, human resource development. ConceptDraw DIAGRAM software is perfect for creation HR Dashboard with any goal you need. It gives you all opportunities for designing not only informative, but also professional looking and attractive HR Dashboards of any style and degree of detalization, that are perfect for using in presentations, reports and other thematic documents.
Process Flow Chart Symbol

 Sales Dashboard
Sales Dashboard solution extends ConceptDraw DIAGRAM software with templates, samples and library of vector stencils for drawing the visual dashboards of sale metrics and key performance indicators (KPI).
 Economy Infographics
The Economy Infographics solution provides a large collection of vector icon libraries, drawing samples and infographic examples for quick and simple design of the best infographics, illustrations, and presentations about economics, markets, economic policy, business, finances, government and social institutions, production, distribution, and consumption of goods and services, economic diagrams and schemes, economic activities designs, continent and country economic maps, economic presentations, market economy and economic system infographic charts, illustrations in economic articles, reports in mass media, and blog posts in social media. It is a valuable tool for wide range of economists, politicians, managers, marketing experts, business analysts, journalists and bloggers focusing on economy, educators and students studying economics, and many other people to communicate visually the economic information.
 Line Graphs
The Line Graphs solution extends the capabilities of ConceptDraw DIAGRAM with professionally designed templates, samples, and a library of vector stencils for drawing perfect Line Graphs. Turn your data into a Line Graph with ConceptDraw DIAGRAM software and use it in any document, presentation, report, share it with your team, etc. Building several curves on the same chart, it is recommended to paint them with different colors, this will allow to separate them visually from each other and will make it easier the data comparison.
 Business Diagrams
The Business Diagrams Solution extends ConceptDraw DIAGRAM with an extensive collection of professionally designed illustrative samples and a wide variety of vector stencils libraries, which are the real help for all business-related people, business analysts, business managers, business advisers, marketing experts, PR managers, knowledge workers, scientists, and other stakeholders allowing them to design the bright, neat, expressive and attractive Bubble Diagrams, Circle-Spoke Diagrams, Circular Arrows Diagrams, and Venn Diagrams with different quantity of sets in just minutes; and then successfully use them in documents, reports, statistical summaries, and presentations of any style.
Sales Process Flowchart Symbols

 Timeline Diagrams
Timeline Diagrams solution extends ConceptDraw DIAGRAM diagramming software with samples, templates and libraries of specially developed smart vector design elements of timeline bars, time intervals, milestones, events, today marker, legend, and many other elements with custom properties, helpful for professional drawing clear and intuitive Timeline Diagrams. Use it to design simple Timeline Diagrams and designate only the main project stages, or highly detailed Timeline Diagrams depicting all project tasks, subtasks, milestones, deadlines, responsible persons and other description information, ideal for applying in presentations, reports, education materials, and other documentation.
Structured Systems Analysis and Design Method. SSADM with ConceptDraw DIAGRAM

Process Flowchart Symbols

Business and Finance Illustrations

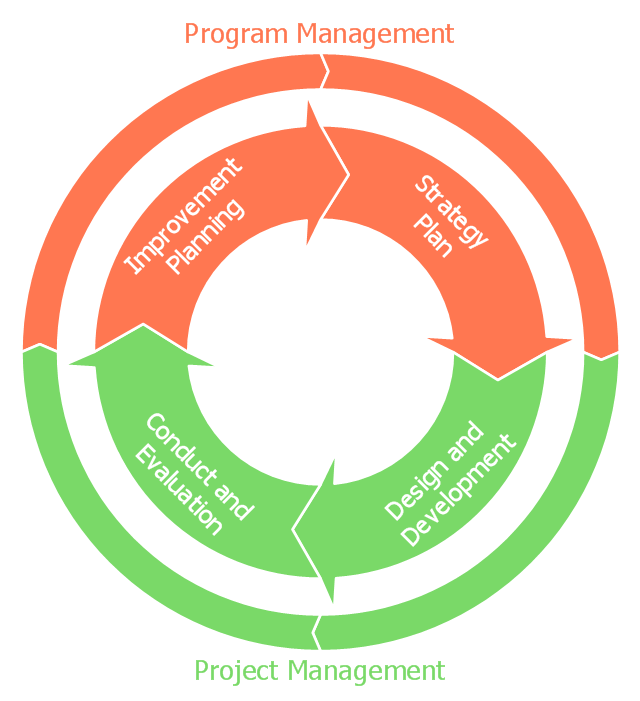
This circular arrows diagram sample shows the exercise cycle stages: 1) Strategy plan, 2) Design and development, 3) Conduct and evaluation, 4) Improvement planning. It was designed on the base of the diagram on the Emergency Management Insitute training IS-120.b webpage from the website of the Federal Emergency Management Agency (FEMA) of the United States Department of Homeland Security.
[emilms.fema.gov/ IS120A/ summary.htm]
"Exercises give communities, states, and regions a set of essential tools to prevent, prepare for, respond to, and recover from disasters." [emilms.fema.gov/ IS120A/ module0.htm]
"Disaster management (or emergency management) is the creation of plans through which communities reduce vulnerability to hazards and cope with disasters. Disaster management does not avert or eliminate the threats; instead, it focuses on creating plans to decrease the effect of disasters. Failure to create a plan could lead to human mortality, lost revenue, and damage to assets. Currently in the United States 60 percent of businesses do not have emergency management plans. Events covered by disaster management include acts of terrorism, industrial sabotage, fire, natural disasters (such as earthquakes, hurricanes, etc.), public disorder, industrial accidents, and communication failures." [Emergency management. Wikipedia]
The diagram example "Emergency management exercise cycle" was created using the ConceptDraw PRO diagramming and vector drawing software extended with the Basic Circular Arrows Diagrams solution from the area "What is a Diagram" of ConceptDraw Solution Park.
Circular arrows diagram
 PM Mind Maps and Tables
PM Mind Maps and Tables solution extends the functional abilities of ConceptDraw DIAGRAM and ConceptDraw MINDMAP software with a set of drawing tools, professionally developed samples and templates allowing to prepare the project documentation including wide set of charts, tables, matrices, and Mind Maps. Being intended for the project manager, senior managers, team leaders and other project team members, it facilitates the execution of main project manager duties, contributes effective project planning and project management process implementation, increasing productivity in project planning, documenting, project presentation, tracking the progress and reporting.
- An Event-driven Process Chain (EPC) | Event Planning Flowchart
- Process Flowchart | Dfd For Online Event Planning Organisations
- Business Process Flowchart Symbols | Process Flow Chart Symbol ...
- Emergency management exercise cycle | National Preparedness ...
- Emergency management exercise cycle | Work Flow Diagram
- Organizational Chart Templates | Sales Process Flowchart ...
- Audit Flowchart Symbols | Audit Process Flowchart . Audit Flowchart ...
- Cross-functional flowchart | Flowcharts | Modelling Complex Events ...
- Emergency management exercise cycle | Types of Flowchart ...