This site uses cookies. By continuing to browse the ConceptDraw site you are agreeing to our Use of Site Cookies.

Entity Relationship Diagram Examples

Creating an entity-relationship (ER) model is to visually represent the structure of a business database, where data equates to entities (or objects) that are linked by defined relationships expressing dependencies and requirements. By nature it is an abstract visualization, the first step in the design process towards creating a logical and functional database.
ConceptDraw gives the ability to describe a database using the Entity-Relationship model. Entity-Relationship Diagram solution includes icons advocated by Chen's and Crow’s Foot notation that can be used when describing a database.
How to Build an Entity Relationship Diagram (ERD)

Entity Relationship Diagram - ERD - Software for Design Crows Foot ER Diagrams

Crow's Foot notation was proposed by Gordon Everest. According to this notation, the entity is represented by rectangle, relation is depicted by line which ties two entities involved in a relationship. Entity-relationship diagrams based on both Chen's and Crow's Foot notations, can be easily drawn using the ConceptDraw DIAGRAM ERD diagrams software tools for design element Crow's Foot and Chen from Entity-Relationship Diagram (ERD) solution.
How to Build an Entity Relationship Diagram (ERD)

entity-relationship diagram, ER-diagram, database ERD Entity-Relationship Diagram (ERD)

entity-relationship diagram, ER-diagram, database ERD
An Entity-Relationship Diagram (ERD) is a visual presentation of entities and relationships. That type of diagrams is often used in the semi-structured or unstructured data in databases and information systems. At first glance ERD is similar to a flowch

Entity Relationship Diagram Symbols

Creating an entity-relationship (ER) model is to visually represent the structure of a business database, where data equates to entities (or objects) that are linked by defined relationships expressing dependencies and requirements. By nature it is an abstract visualization, the first step in the design process towards creating a logical and functional database.
ERD symbols used for professional ERD drawing are collected in libraries from the Entity-Relationship Diagram (ERD) solution for ConceptDraw DIAGRAM.

Design Element: Crows Foot for Entity Relationship Diagram - ERD

Creating an ERD requires choosing a specific set of notations that best serve the specific database being designed. ConceptDraw DIAGRAM software extended with Entity-Relationship Diagram (ERD) solution from Software Development area of ConceptDraw Solution Park allows you to draw ER diagrams for depicting a database using the ERD diagram design element Crow's Foot - Crow′s Foot notation icons.

Data Flow Diagram Examples

You need to draw the Data Flow Diagram? Use ConceptDraw DIAGRAM diagramming and vector drawing software extended with Data Flow Diagrams solution from the Software Development area of ConceptDraw Solution Park.The Data Flow Diagrams solution provides a numerous collection of Data Flow Diagram examples created according to Gane and Sarson, and Yourdon and Coad notations using the ConceptDraw DIAGRAM software.

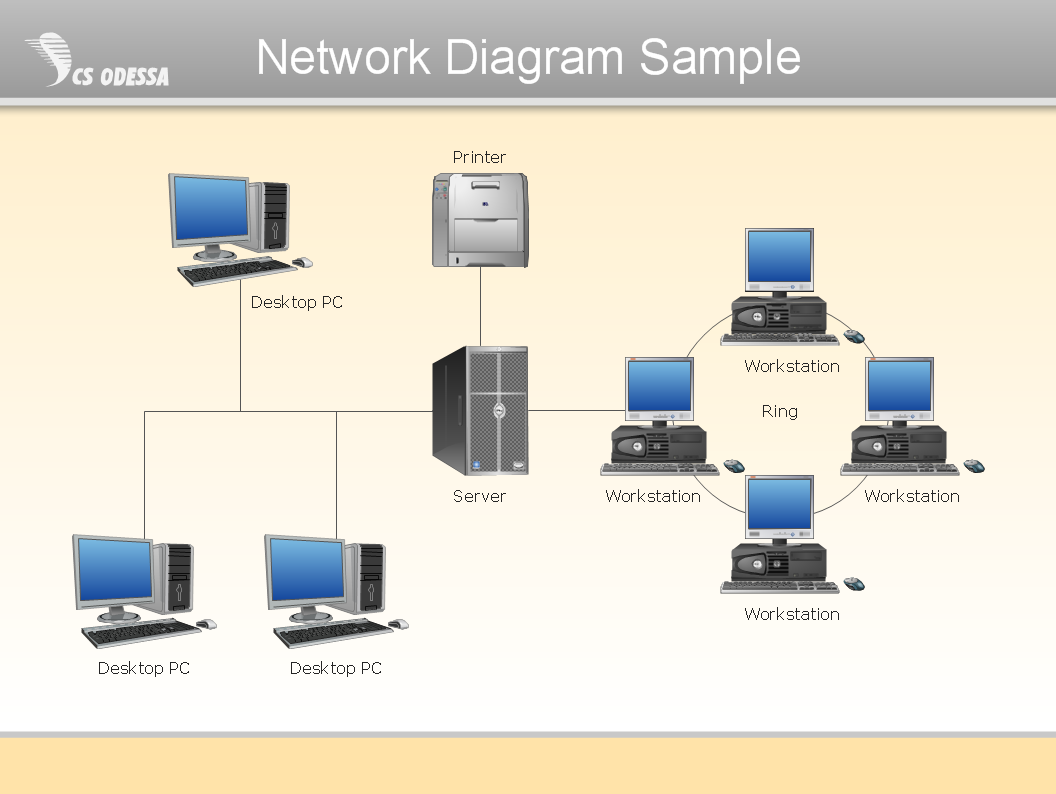
Network Diagram Software Physical Network Diagram

ConceptDraw Network Diagram Software is ideal for network engineers and network designers who need to draw Physical Network Diagrams.

ERD, entity-relationship diagram, ER-diagram, Crow’s Foot Notation Crow's Foot Notation

ERD, entity-relationship diagram, ER-diagram, Crow’s Foot Notation
Crow’s Foot Notation solution extends ConceptDraw DIAGRAM software with powerful drawing tools, samples and library of predesigned vector Crow's Foot notation icons to help you easy describe the databases using the Entity-Relationship models and design professional-looking ER diagrams based on the popular Crow's Foot notation.

UML Class Diagram Generalization Example UML Diagrams

This sample was created in ConceptDraw DIAGRAM diagramming and vector drawing software using the UML Class Diagram library of the Rapid UML Solution from the Software Development area of ConceptDraw Solution Park.
This sample describes the use of the classes, the generalization associations between them, the multiplicity of associations and constraints. Provided UML diagram is one of the examples set that are part of Rapid UML solution.

Campus Area Networks (CAN). Computer and Network Examples

A campus network provides wireless access to the Internet or LAN to users located in two or more buildings or in the open space surrounding those buildings. A campus network is usually set in the campus of a university, but the same kind of planning and design can be applied for other purposes. For example, the campus network can used for an office or industrial park, in a public place like a supermarket with an entertainment center, even on a farm. Another form of temporary campus network can exist during special events such as music festivals or rallies.
The elementary campus networks arise spontaneously: the radio signals from the access points, which provide network inside the building are not limited to its walls, so any user in the backyard can also get wireless network access. The larger and more complex campus network may have additional access points in places specially chosen for serving clients, i.e., on the lawn in front of the college or in a coffee shop around the corner.