Flowchart Components

Types of Flowcharts


Basic of Flowchart: Meaning and Symbols


 Business Diagrams
The Business Diagrams Solution extends ConceptDraw DIAGRAM with an extensive collection of professionally designed illustrative samples and a wide variety of vector stencils libraries, which are the real help for all business-related people, business analysts, business managers, business advisers, marketing experts, PR managers, knowledge workers, scientists, and other stakeholders allowing them to design the bright, neat, expressive and attractive Bubble Diagrams, Circle-Spoke Diagrams, Circular Arrows Diagrams, and Venn Diagrams with different quantity of sets in just minutes; and then successfully use them in documents, reports, statistical summaries, and presentations of any style.
 Sales Flowcharts
The Sales Flowcharts solution lets you create and display sales process maps, sales process workflows, sales steps, the sales process, and anything else involving sales process management.
Sales Process

 EXPRESS-G data Modeling Diagram
EXPRESS-G data Modeling Diagram solution extends the ConceptDraw DIAGRAM software functionality with capabilities of EXPRESS data modeling language, includes powerful data modeling tools, Express-G diagram tool, database diagram tool, database design tool, wide variety of pre-made vector objects of EXPRESS-G notation and EXPRESS-G diagrams samples allowing software developers, software designers, software engineers and other stakeholders to make their data models for information systems, to develop the databases, to learn the principles of construction EXPRESS-G diagrams and helping to draw their own EXPRESS-G Data Modeling Diagrams, Express-G Diagrams or Database Model Diagram without any efforts.
 HR Flowcharts
The HR Flowcharts solution is ideal for using while creating the HR-related drawings in the ConceptDraw DIAGRAM charting and drawing software, providing with a comprehensive collection of human resources themed icons, connectors, and images from the available stencil libraries, helping illustrating flowcharts, infographics and workflow diagrams.
What is a Local Area Network? Examples of LAN Diagrams
 diagram")

Express-G Diagram

Sales Process Steps

 Business Package for Management
Package intended for professional who designing and documenting business processes, preparing business reports, plan projects and manage projects, manage organizational changes, prepare operational instructions, supervising specific department of an organization, workout customer service processes and prepare trainings for customer service personal, carry out a variety of duties to organize business workflow.
Recruitment

Structured Systems Analysis and Design Method. SSADM with ConceptDraw DIAGRAM

This vector stencils library contains 54 BDD symbols.
Use it to design your block definition diagrams using ConceptDraw PRO diagramming and vector drawing software.
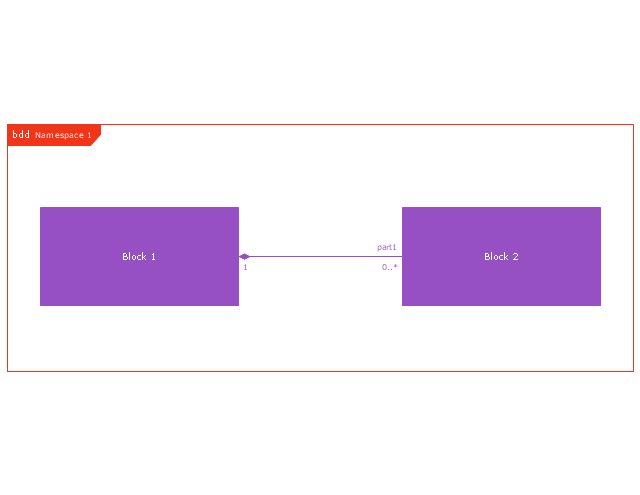
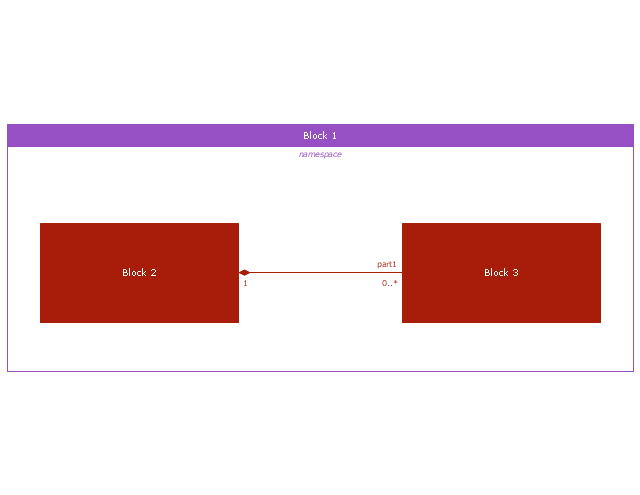
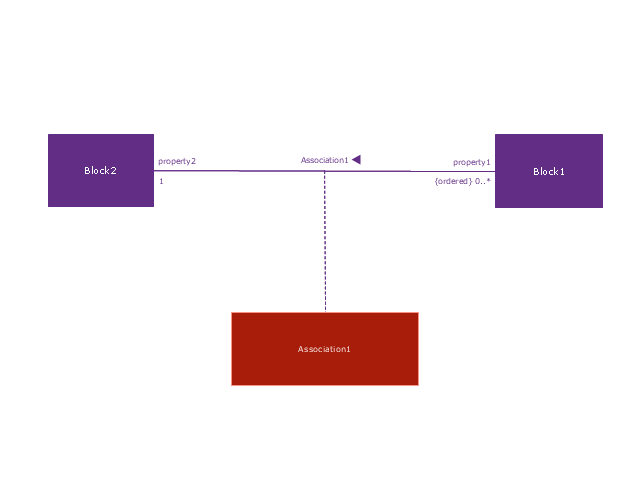
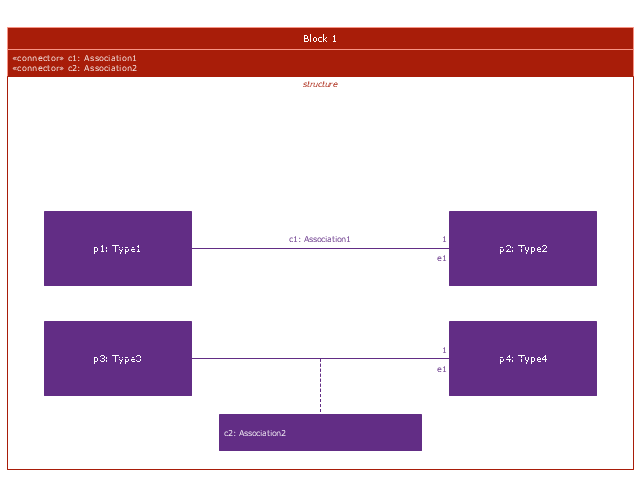
"Block Definition Diagram
A block definition diagram is based on the UML class diagram, with restrictions and extensions as defined by SysML. ...
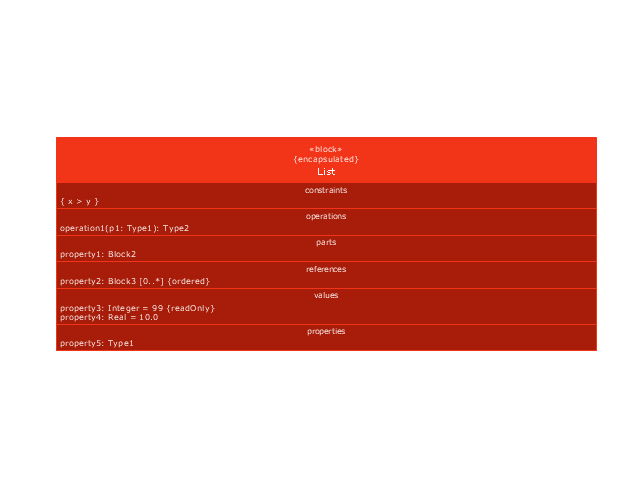
Block and ValueType Definitions
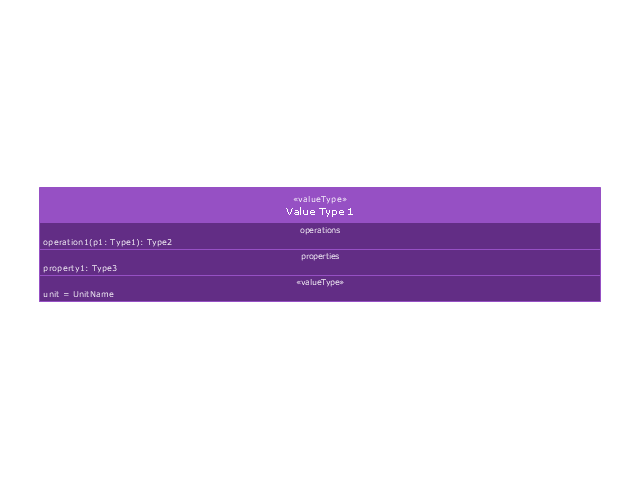
A SysML Block defines a collection of features to describe a system or other element of interest. A SysML ValueType
defines values that may be used within a model. SysML blocks are based on UML classes, as extended by UML composite structures. SysML value types are based on UML data types. Diagram extensions for SysML blocks and value types are described by other subheadings of this sub clause." [www.omg.org/ spec/ SysML/ 1.3/ PDF]
The vector stencils library "Block definition diagram" is included in the SysML solution from the Software Development area of ConceptDraw Solution Park.
Use it to design your block definition diagrams using ConceptDraw PRO diagramming and vector drawing software.
"Block Definition Diagram
A block definition diagram is based on the UML class diagram, with restrictions and extensions as defined by SysML. ...
Block and ValueType Definitions
A SysML Block defines a collection of features to describe a system or other element of interest. A SysML ValueType
defines values that may be used within a model. SysML blocks are based on UML classes, as extended by UML composite structures. SysML value types are based on UML data types. Diagram extensions for SysML blocks and value types are described by other subheadings of this sub clause." [www.omg.org/ spec/ SysML/ 1.3/ PDF]
The vector stencils library "Block definition diagram" is included in the SysML solution from the Software Development area of ConceptDraw Solution Park.
Block definition diagram
Block
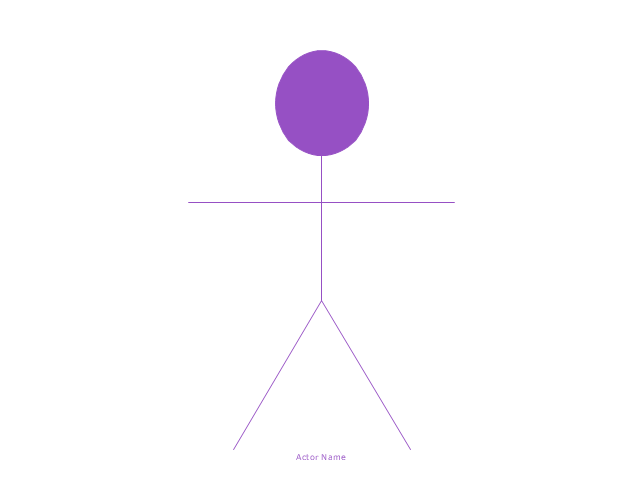
Actor
Actor 2

Value type
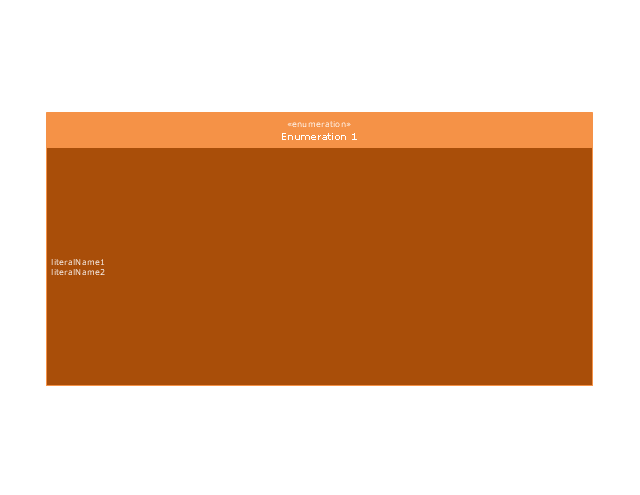
Enumeration
Abstract definition

Abstract definition 2
Abstract definition 3
Stereotype property compartment

Namespace compartment
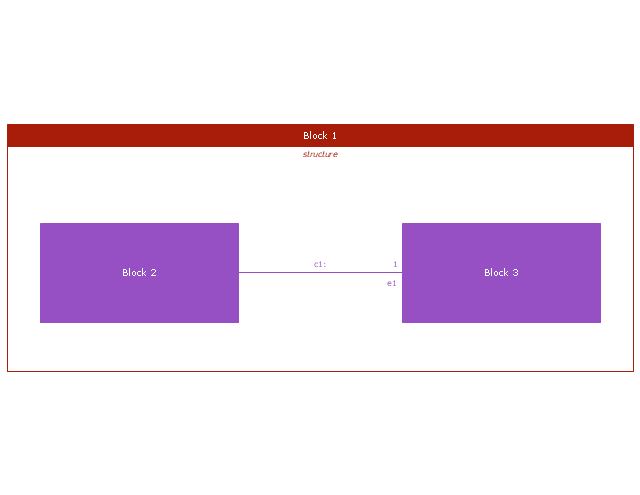
Structure compartment
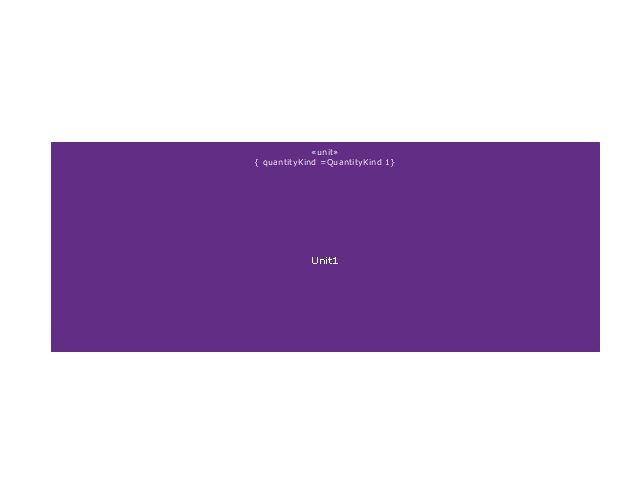
Unit
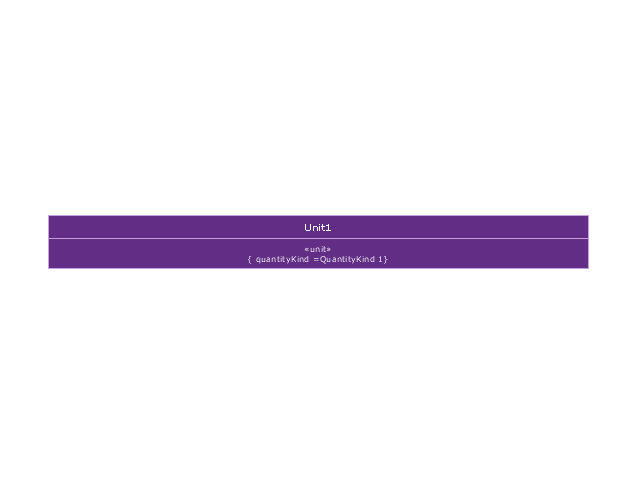
Unit 2
Quantity kind

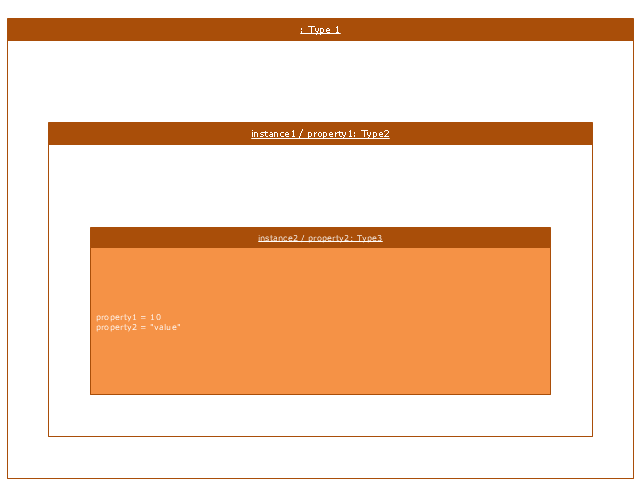
Instance specification
Instance specification 2

Instance specification 3
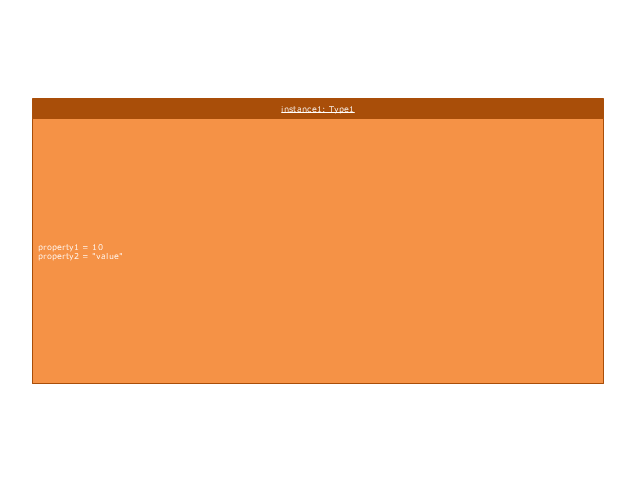
Instance specification 4
Dependency
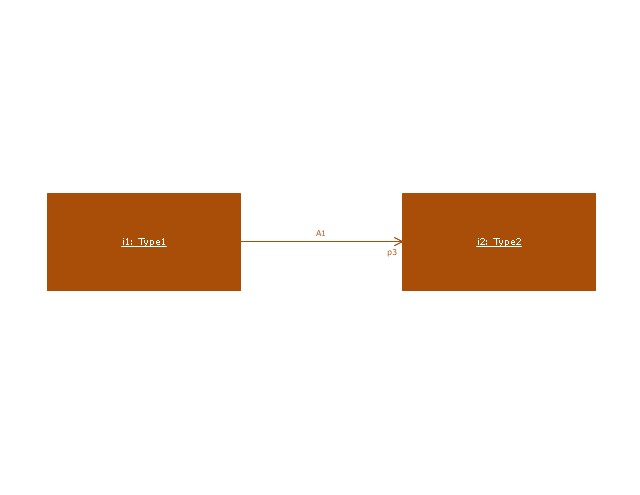
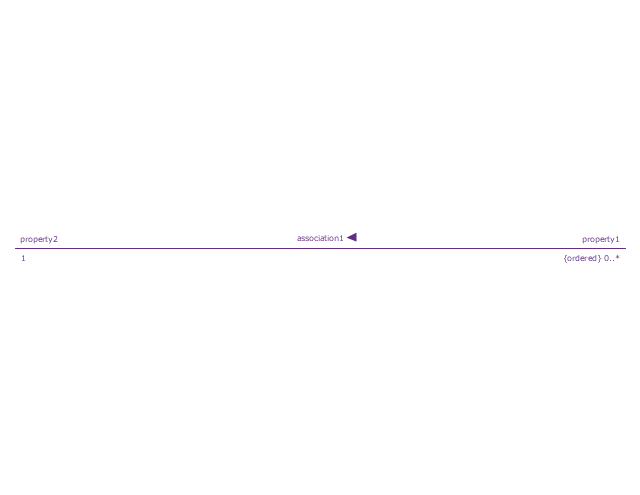
Reference association
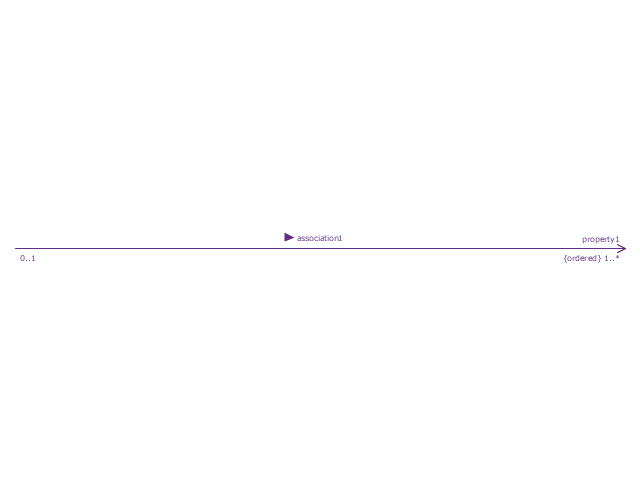
Reference association 2
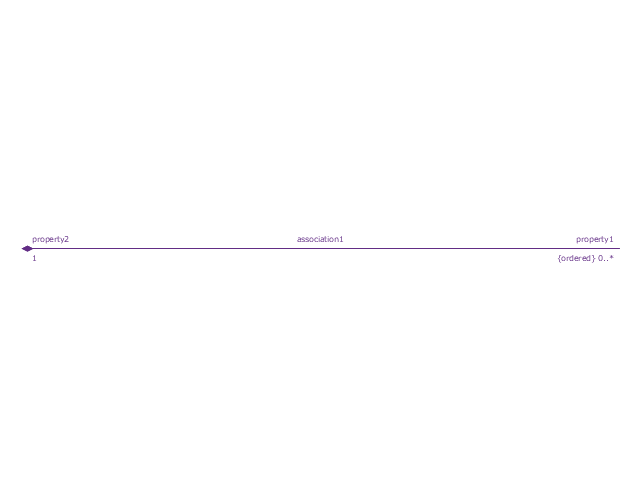
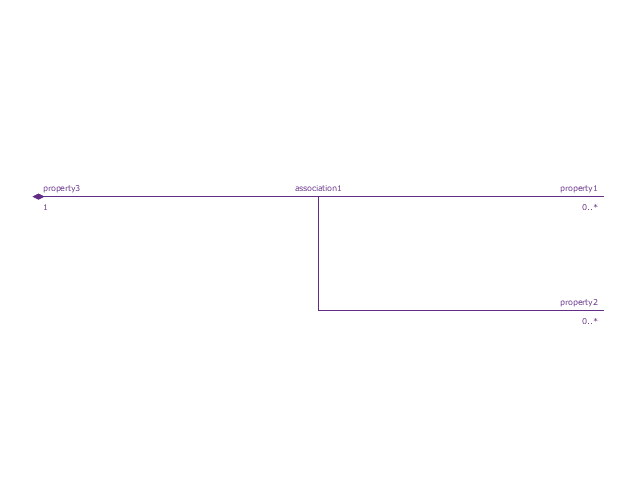
Part association
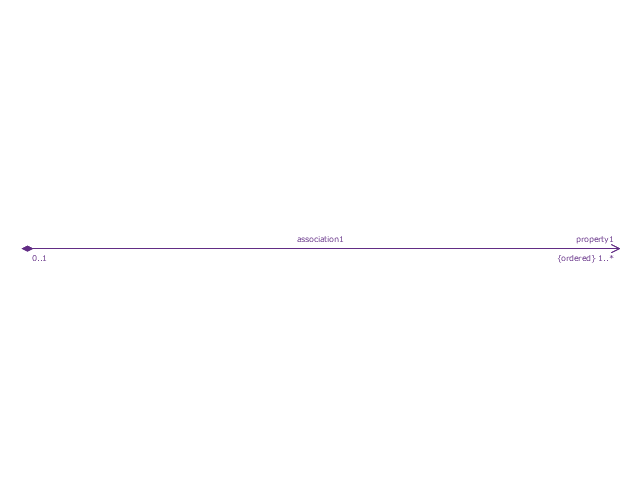
Part association 2
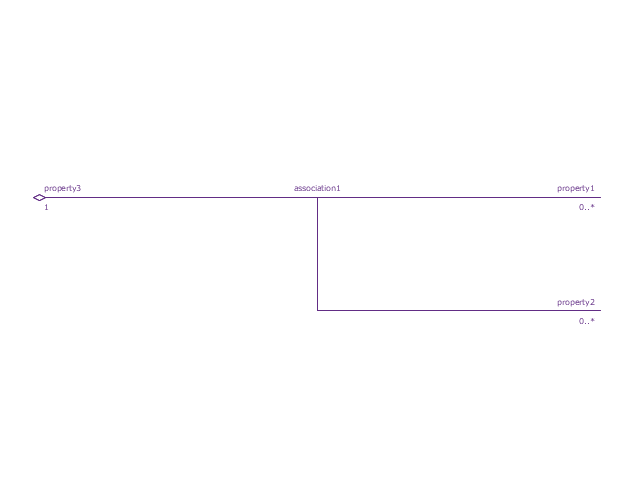
Shared association
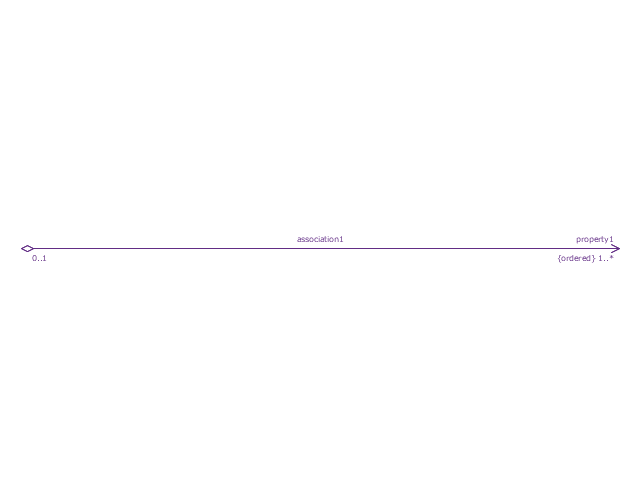
Shared association 2

Multibranch part association
Multibranch shared association
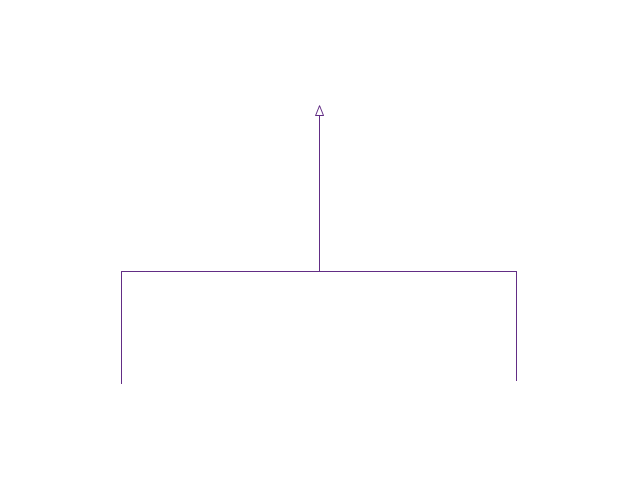
Generalization

Multibranch generalization
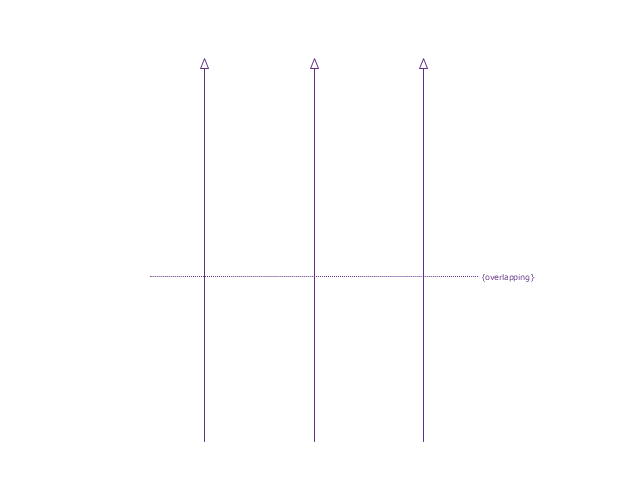
Generalization set, disjoint
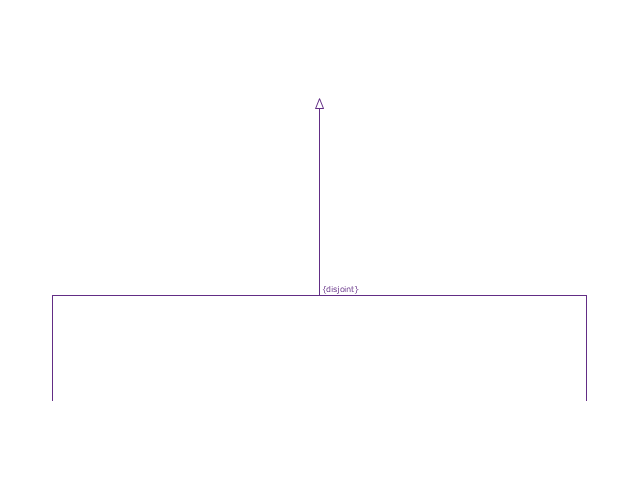
Generalization set, overlapping
Block namespace containment
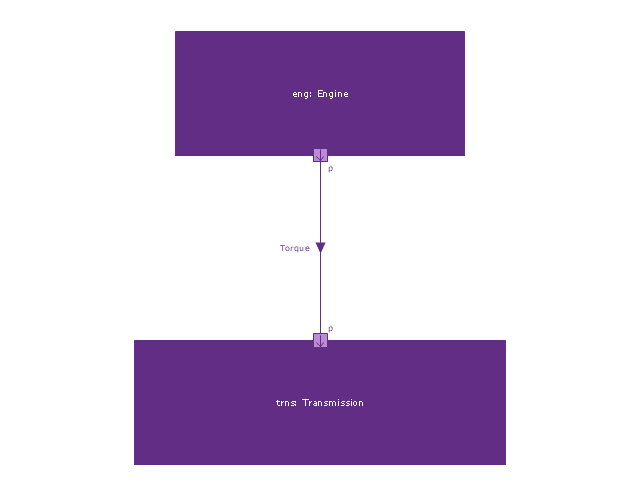
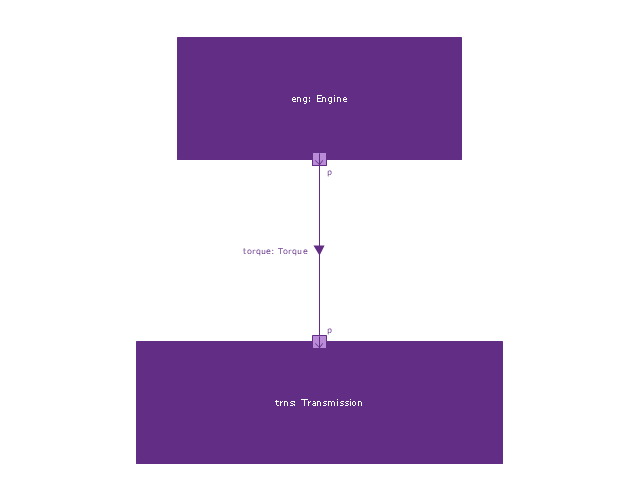
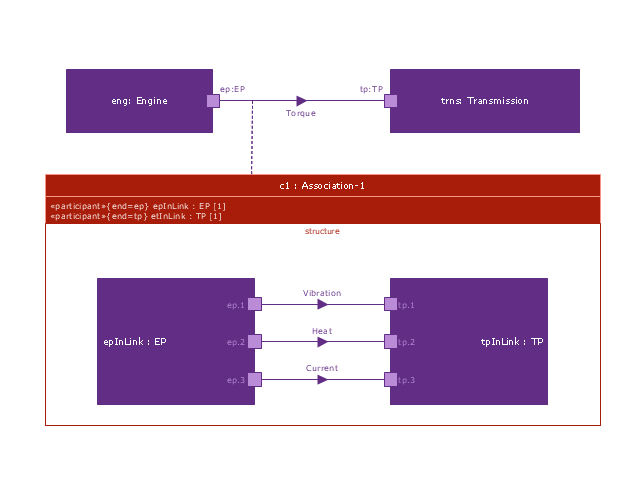
Participant property
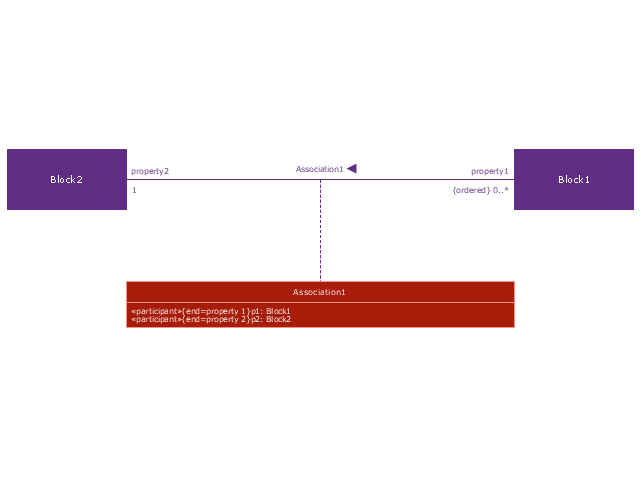
Participant property 2
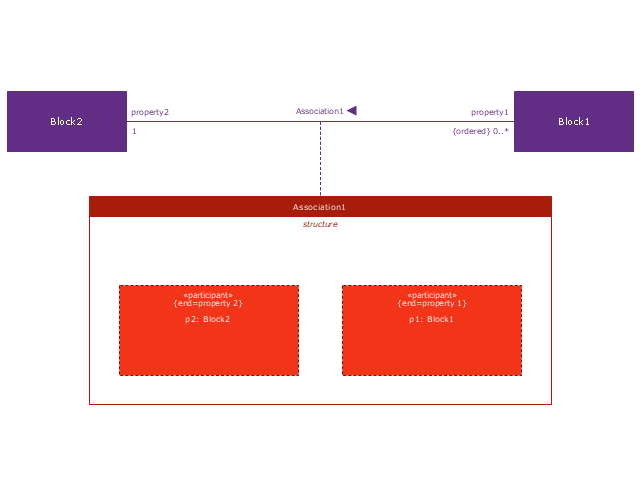
Participant property 3
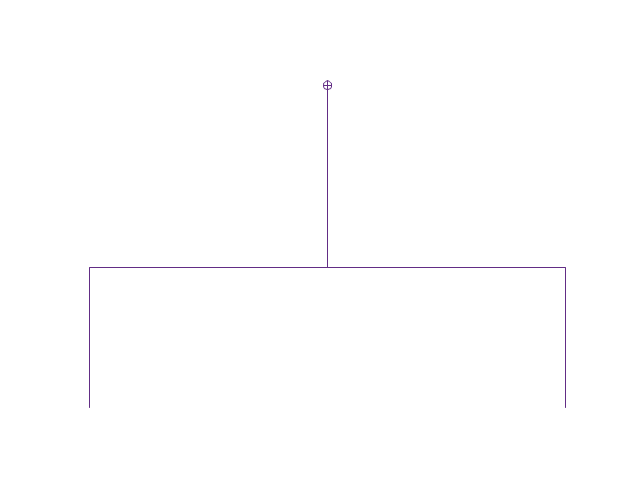
Connector property
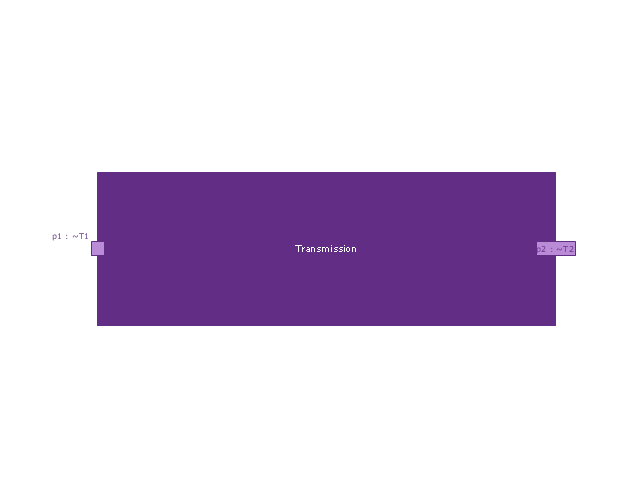
Conjugated ports
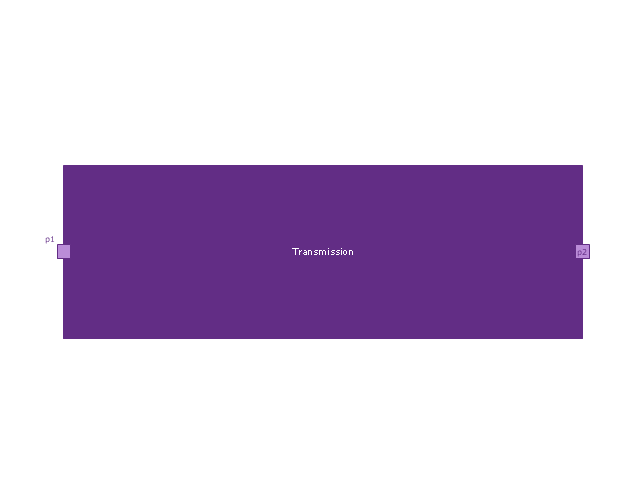
Conjugated ports 2
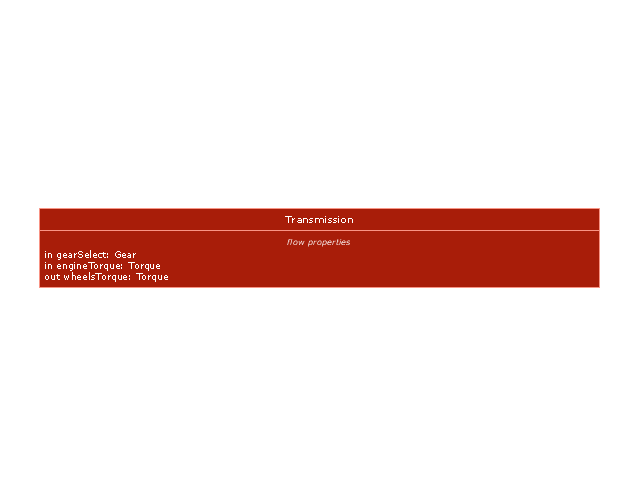
Ports with flow properties

Port (compartment notation)
-vector-stencils-library---block-definition-diagram.png--diagram-flowchart-example.png)
Port (nested)
-vector-stencils-library---block-definition-diagram.png--diagram-flowchart-example.png)
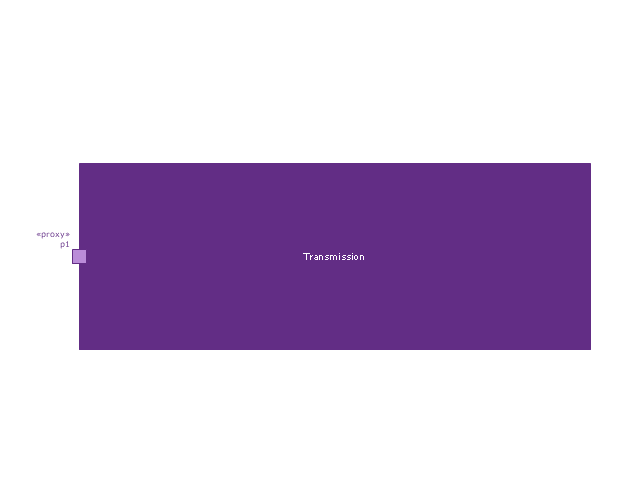
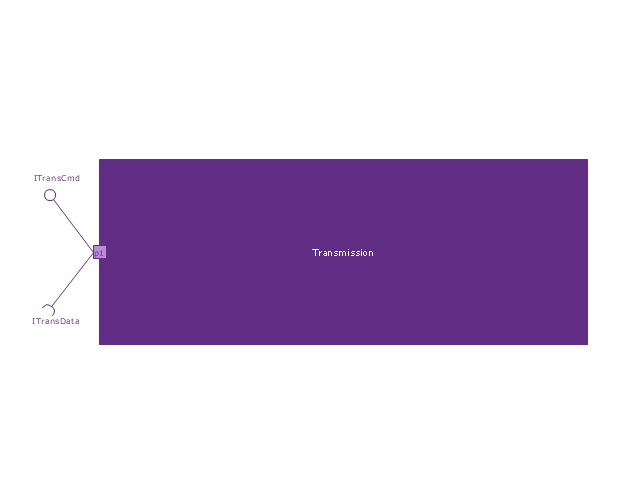
Proxy port
Full port

Flow property
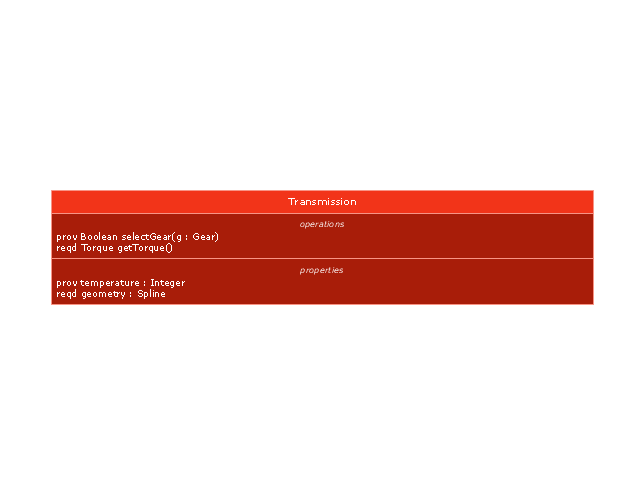
Required and provided features
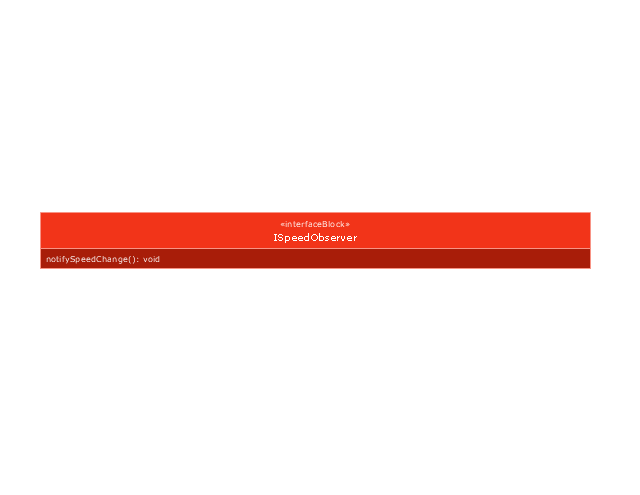
Interface block
Item flow
Item flow 2
Item flow 3
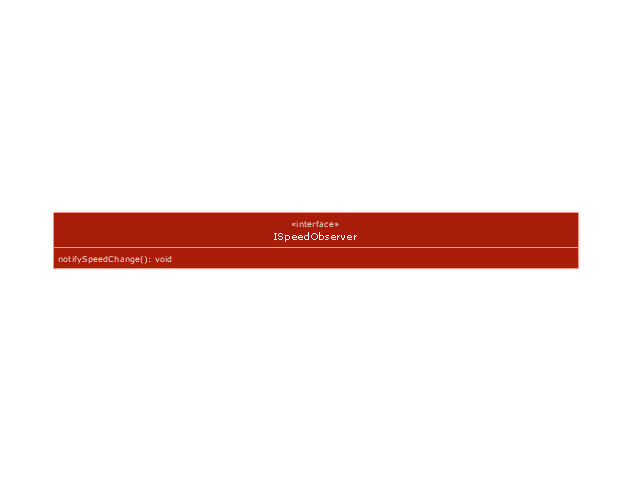
Interface
Required and provided interfaces

Required and provided interfaces 2
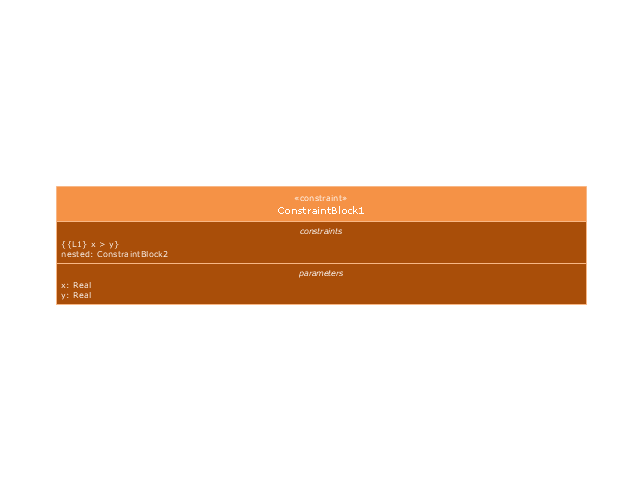
Constraint block
HR Management Software

HR Department Flow Chart

 Business Diagrams Package
Business Diagrams Package is a large set of comprehensive graphical solutions from the ConceptDraw Solution Park, which are powerful in solving the business, marketing and quality tasks in completely different fields, such as finance, education, health food and cooking, HR, and many others. The tools of this package's solutions are a powerful assistant in drawing all diversity of Financial and Marketing infographics, Business process workflow diagrams, Organizational charts, Education infographics, Quality diagrams, Health food diagrams, HR flowcharts, as well as different graphics and charts, which depict the values of key business indicators, their dependencies, give the full understanding of a situation within a company and on the market.
Human Resources

- | Flowcharts | List And Explain Type Of Flowchart
- | How to Draw a Chemical Process Flow Diagram | Hiring process ...
- Use Case Diagrams technology with ConceptDraw PRO | IDEF3 ...
- Cross-Functional Flowchart - The easiest way to draw ...
- Types of Flowcharts - Overview | List And Explain Types Of Flow Chart
- | List 10 Flowchart Symbols
- Mention The Type Of Flowchart
- Types of Flowchart - Overview | Accounting Involves Several ...
- Basic Flowchart Symbols and Meaning | Process Flowchart | Entity ...
- Accounting Flowchart Symbols | Accounting Information Systems ...