HelpDesk
How to Create a Bubble Diagram Using ConceptDraw PRO
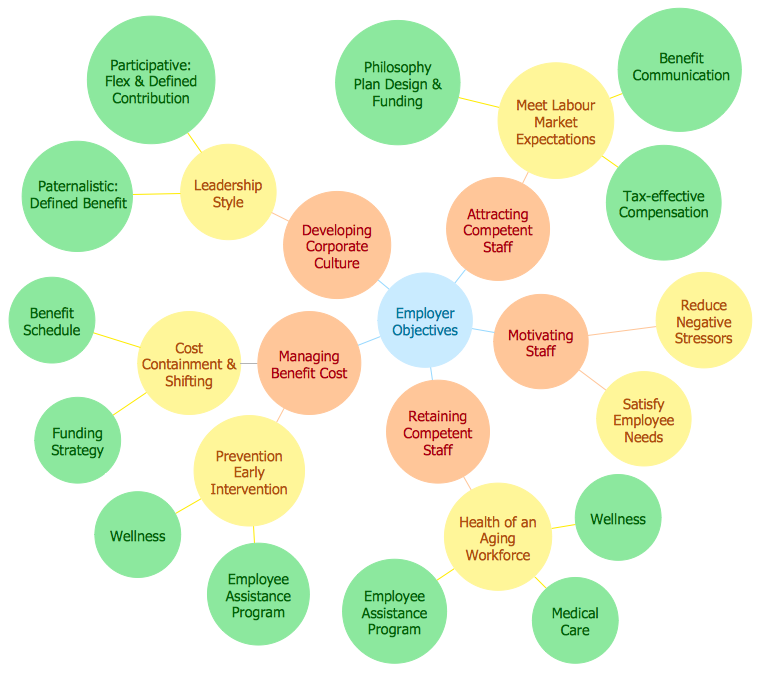
Bubble Diagram is a simple chart that consists of circles (bubbles) repesening certain topics or processes. Bubbles are connected by lines depicting the type of relationships between the bubbles. The size of each bubble is depended on the importance of the entity it represents. Bubble charts are widely used throughout social, economical, medical, and other scientific researches as well as throughout architecture and business management. Bubble charts are often used during the early stages of product development to visualize thoughts and ideas for the purpose of sketching out a development plan. ConceptDraw PRO allows you to draw a bubble diagrams using the Bubble Diagrams solution.
 Organizational Charts
Organizational Charts solution extends ConceptDraw PRO software with samples, templates and library of vector stencils for drawing the org charts.
HelpDesk
How to Draw an Organizational Chart Using ConceptDraw PRO
The organizational chart software is a valuable tool for modern business. It is important for any business to build a clear organizational structure that determines the responsibilities and relationships between different positions in the organization. The clear structured organization - means the clear structured business workflow, which is the core of success in the business. ConceptDraw PRO is an org chart software that allows you to draw an organizational structure of your company quickly and easily.- Marketing Organization Chart | How to Draw an Organization Chart ...
- How to Draw an Organization Chart | Organizational Structure | How ...
- Process Flow Chart Marketing Department
- Process Flow Chart Of Marketing Department
- Marketing and Sales Organization chart . Organization chart Example
- Draw The Organizational Chart Of The Marketing Department
- Marketing and Sales Organization chart . Organization chart ...
- How to Draw an Organization Chart | Examples of Flowcharts, Org ...
- Flow Chart For Marketing Department
- Organizational Structure | How to Draw an Organization Chart ...
- Draw Organization Chart For A Marketing Department
- Organization Chart Software | Marketing and Sales Organization ...
- Draw A Marketing Organization
- Marketing Department Process Flow Chart
- Draw A Chart Of Business Market
- Flowchart Of Marketing Department
- Organogram Software | Organizational Structure | How to Draw an ...
- Organizational Structure | Marketing and Sales Organization chart ...
- Flowchart Marketing Process. Flowchart Examples | Marketing Flow ...

