Basic Flowchart Symbols and Meaning


Process Flowchart


Basic Diagramming


HelpDesk
How to Draw a Circle-Spoke Diagram Using ConceptDraw PRO

HelpDesk
How to Draw a Circular Arrows Diagram Using ConceptDraw PRO

 Circular Arrows Diagrams
Circular Arrows Diagrams solution extends ConceptDraw PRO v10 with extensive drawing tools, predesigned samples, Circular flow diagram template for quick start, and a library of ready circular arrow vector stencils for drawing Circular Arrow Diagrams, Segmented Cycle Diagrams, and Circular Flow Diagrams. The elements in this solution help managers, analysts, business advisers, marketing experts, scientists, lecturers, and other knowledge workers in their daily work.
Draw Flowcharts with ConceptDraw

 Target and Circular Diagrams
This solution extends ConceptDraw PRO software with samples, templates and library of design elements for drawing the Target and Circular Diagrams.
Technical Flow Chart

Drawing Illustration

Agile Methodology

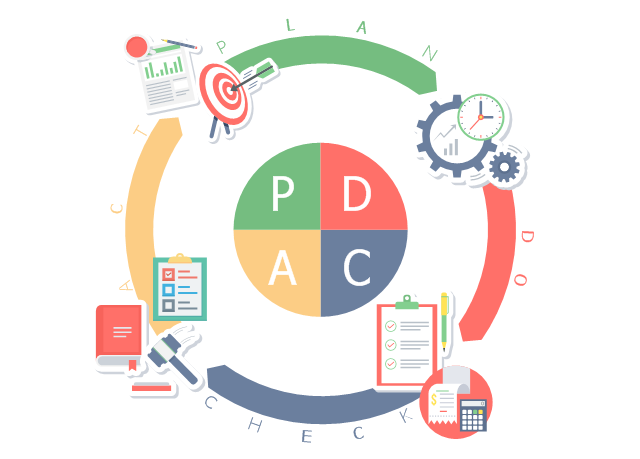
This business infographic sample shows the plan–do–check–act cycle. It was designed on the base of the Wikimedia Commons file: PDCA-Cycle.png.
[commons.wikimedia.org/ wiki/ File:PDCA-Cycle.png]
This file is licensed under the Creative Commons Attribution-Share Alike 3.0 Unported license. [creativecommons.org/ licenses/ by-sa/ 3.0/ deed.en]
"PDCA (plan–do–check–act or plan–do–check–adjust) is an iterative four-step management method used in business for the control and continual improvement of processes and products. It is also known as the Deming circle/ cycle/ wheel, Shewhart cycle, control circle/ cycle, or plan–do–study–act (PDSA)." [PDCA. Wikipedia]
The business infographic example "PDCA cycle" was designed using ConceptDraw PRO diagramming and vector drawing software extended with the Business and Finance solution from Illustration area of ConceptDraw Solution Park.
Infographic
Circular Flow Diagram Template

BPR Diagram. Business Process Reengineering Example

 Project Management Area
Project Management area provides Toolbox solutions to support solving issues related to planning, tracking, milestones, events, resource usage, and other typical project management functions.
- Research cycle - Circle diagram | Innovation life cycle - Arrow loop ...
- CMP adaptive management cycle | Virtuous circle (management ...
- Target and Circular Diagrams | Circular Arrows Diagrams ...
- Program to Make Flow Chart | Project management life cycle ...
- Program to Make Flow Chart | Drawing Illustration | BPR Diagram ...
- Draw A Sketch Of System Development Cycle
- Research cycle - Circle diagram | Innovation life cycle - Arrow loop ...
- Basic Flowchart Symbols and Meaning | Circle Spoke Diagram ...
- CMP adaptive management cycle | Basic Flowchart Symbols and ...
- Draw 3 Program Cycle
- How To Draw A Cycle Diagram In Word
- Purchasing Circle Drawing
- CMP adaptive management cycle | Project management life cycle ...
- Draw Cycle Of Data Conversion In Simple Form
- Communication Cycle Flow Chart
- Circle Bullet
- Draw Flowcharts with ConceptDraw | Circular Arrows Diagrams ...
- Basic Flowchart Symbols and Meaning | Circular Flow Diagram ...
- Basic Diagramming | Process Flowchart | Draw Flowcharts with ...
- Circular Arrows Diagrams | Circular Arrows | Basic Circular Arrows ...