Diagramming Software for Design UML Activity Diagrams


Communication Diagram UML2.0 / Collaboration UML1.x

Credit Card Order Process Flowchart. Flowchart Examples

Ordering Process Flowchart. Flowchart Examples

Cross-Functional Flowchart - The easiest way to draw crossfunctional

UML in 10 mins

Processing Flow Chart

ConceptDraw DIAGRAM enhanced with Flowcharts Solution from the "Diagrams" Area of ConceptDraw Solution Park is a powerful Processing Flow Chart software which will help save lots of your time.
UML Deployment Diagram

Work Order Process Flowchart. Business Process Mapping Examples

Flowchart Definition

Identifying Quality Management System

Systems Engineering

Flowchart Symbols Accounting. Activity-based costing (ABC) flowchart
 flowchart *")
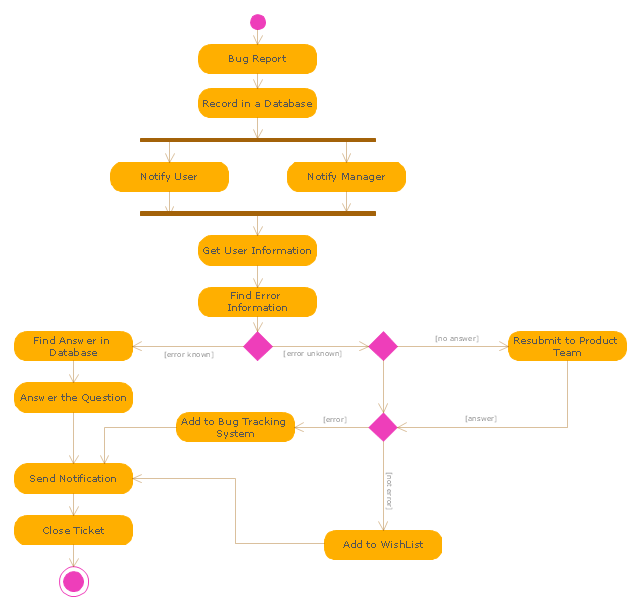
"An issue tracking system (also ITS, trouble ticket system, support ticket, request management or incident ticket system) is a computer software package that manages and maintains lists of issues, as needed by an organization. Issue tracking systems are commonly used in an organization's customer support call center to create, update, and resolve reported customer issues, or even issues reported by that organization's other employees. An issue tracking system often also contains a knowledge base containing information on each customer, resolutions to common problems, and other such data. An issue tracking system is similar to a "bugtracker", and often, a software company will sell both, and some bugtrackers are capable of being used as an issue tracking system, and vice versa. Consistent use of an issue or bug tracking system is considered one of the "hallmarks of a good software team".
A ticket element, within an issue tracking system, is a running report on a particular problem, its status, and other relevant data. They are commonly created in a help desk or call center environment and almost always have a unique reference number, also known as a case, issue or call log number which is used to allow the user or help staff to quickly locate, add to or communicate the status of the user's issue or request.
These tickets are so called because of their origin as small cards within a traditional wall mounted work planning system when this kind of support started. Operators or staff receiving a call or query from a user would fill out a small card with the user's details and a brief summary of the request and place it into a position (usually the last) in a column of pending slots for an appropriate engineer, so determining the staff member who would deal with the query and the priority of the request." [Issue tracking system. Wikipedia]
The UML activity diagram example "Ticket processing system" was created using the ConceptDraw PRO diagramming and vector drawing software extended with the Rapid UML solution from the Software Development area of ConceptDraw Solution Park.
UML activity diagram
 ATM UML Diagrams
The ATM UML Diagrams solution lets you create ATM solutions and UML examples. Use ConceptDraw DIAGRAM as a UML diagram creator to visualize a banking system.
How to Simplify Flow Charting — Cross-functional Flowchart

 Business Process Diagrams
Business Process Flow Diagrams solution extends the ConceptDraw DIAGRAM BPM software with RapidDraw interface, templates, business process diagrams examples and numerous libraries based on the BPMN 1.2 and BPMN 2.0 standards, which give you the possibility to visualize equally easy simple and complex processes, to design business models, to quickly develop and document in details any business processes on the stages of project’s planning and implementation.
Model Based Systems Engineering

Best Program to Make Workflow Diagrams

ER Diagram Programs for Mac

- Purchase order processing UML activity diagram | UML activity ...
- Credit Card Processing System UML Diagram | UML Use Case ...
- Activity Diagram For Credit Card Processing System
- Activity Diagrams For Sales Order Processing System Using Object
- Object Diagram For Order Management System
- Activity Diagram For Order Management System
- Simplified Order Processing System Sequence Diagram
- Order Processing System Flow Chart In Erp
- Credit Card Processing System UML Diagram | Credit Card Order ...
- Work Order Process Flowchart. Business Process Mapping ...
- Purchase order processing UML activity diagram | Diagramming ...
- Purchase order processing UML activity diagram | Event-driven ...
- Credit Card Order Process Flowchart. Flowchart Examples | Credit ...
- Purchase order processing UML activity diagram | EPC diagram ...
- Purchase order processing UML activity diagram | Diagrame Of ...
- Entity-Relationship Diagram (ERD) | Order Processing System Er ...
- Credit Card Order Process Flowchart. Flowchart Examples ...
- Erd For Sales Order Processing System
- Rapid UML | Activity Diagram For Credit Card Processing System In ...
- Swim Lane Flowchart Symbols | Automated payroll management ...