Energy Pyramid Diagram
Energy Pyramid Diagram is a visual graphical representation of the biomass productivity on the each trophic level in a given ecosystem. Its designing in ConceptDraw PRO will not take much time thanks to the unique Pyramid Diagrams solution from the Marketing area of ConceptDraw Solution Park. Energy Pyramid Diagram begins from the producers (plants) and proceeds through a few trophic levels of consumers (herbivores which eat these plants, the carnivores which eat these herbivores, then carnivores which eat those carnivores, and so on) to the top of the food chain.Diagram of a Pyramid
Pyramid diagram is a convenient way of representing data hierarchical structure and visualization relationships between hierarchy levels. You need create the diagram of a pyramid? ConceptDraw diagramming and vector drawing software supplied with Pyramid Diagrams Solution from the Marketing Area of ConceptDraw Solution Park is the best tool for drawing attractive and successful diagram of a pyramid.Pyramid Diagram
The Project Management Triangle Diagram depicts three main constraints of any project: scope, time and cost. Projects have to comply with the specified scope, projects should be finished in time and projects need to consume the budget. Each of the constraints represents one side of the triangle, and any change in budget or timing or scope affects the entire diagram. This diagram was made using ConceptDraw Office suite including best marketing project management software extended with collection of tools for creative project management software and project management reporting software symbols.Pyramid Diagram
The Time-Money-Quality Triangle illustrates an advertising truism, that you can't have all three.Pyramid Chart Maker
ConceptDraw PRO is a powerful diagramming and vector drawing software which offers the extensive drawing tools for creating various types of diagrams. Extended with Pyramid Diagrams Solution from the Marketing Area, it became the best Pyramid Chart Maker.Pyramid Charts
ConceptDraw PRO extended with Pyramid Diagrams Solution from the Marketing Area of ConceptDraw Solution Park is a powerful Pyramid Charts making software. A Pyramid Chart has the form of triangle and hierarchically structures, organizes and help to analyze the information, data or ideas. Triangle is divided on the sections that usually have different widths. The width indicates the level of hierarchy among the topics.Pyramid Diagram
At the base of the identity of an organisational is its organizational culture.Chart Examples
Easy charting software comes with beautiful chart templates and examples. This makes it easy to create professional charts without prior experience.Competitor Analysis
Competitor analysis is a first and obligatory step in elaboration the proper corporate marketing strategy and creating sustainable competitive advantage. Use powerful opportunities of numerous solutions from ConceptDraw Solution Park for designing illustrative diagrams, charts, matrices which are necessary for effective competitor analysis.Chart Templates
Easy charting software comes with beautiful chart templates and examples. This makes it easy to create professional charts without prior experience.Scatter Chart Examples
The Line Graphs solution from Graphs and Charts area of ConceptDraw Solution Park contains a set of examples, templates and design elements library of scatter charts. Use it to draw scatter graphs using ConceptDraw PRO diagramming and vector drawing software for illustrating your documents, presentations and websites.3 Ways to Quickly Create Excellent Presentations
When you decide to represent data without spending lots of time you can effectively generate, change, and update your presentation to best meet your needs with ConceptDraw MINDMAP.Best Multi-Platform Diagram Software
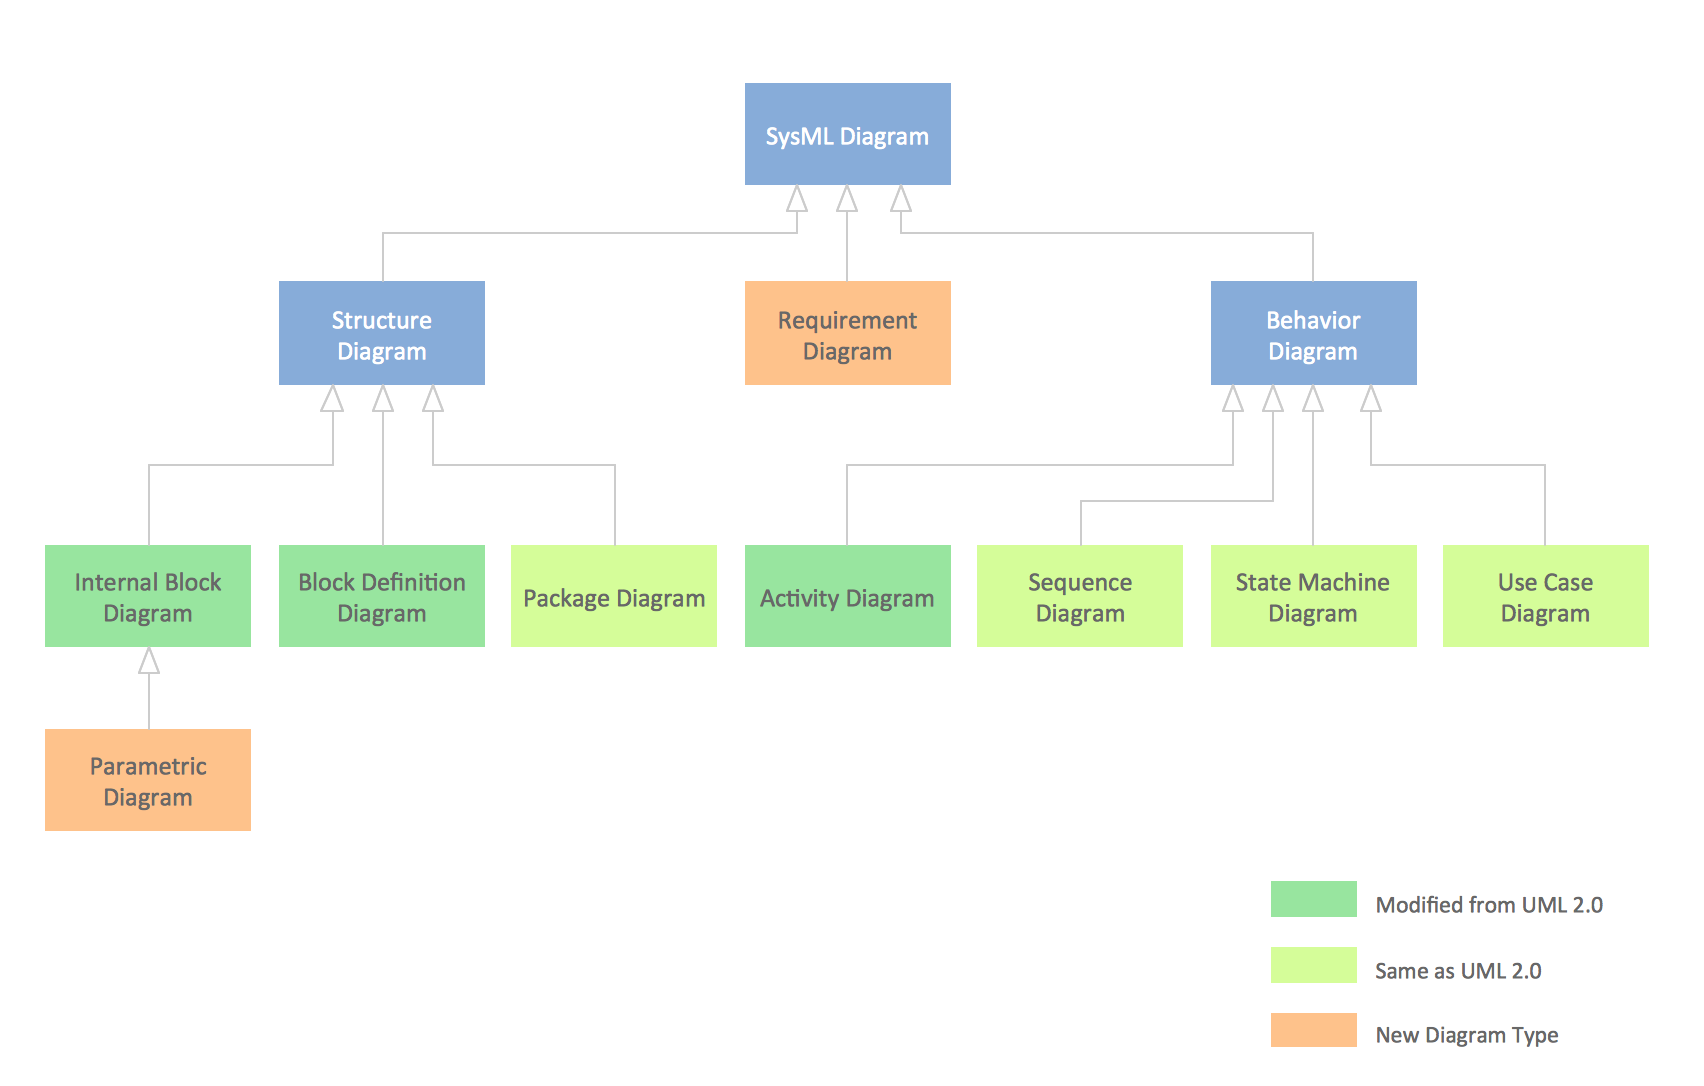
ConceptDraw PRO is a powerful tool for drawing business communication ideas and concepts, simple visual presentation of numerical data in the Mac environment.SysML Diagram
To draw SysML diagrams use the ConceptDraw PRO diagramming and vector drawing software extended with the Rapid UML solution from the Software Development area of ConceptDraw Solution Park.How to Create a Line Chart
Create a Line Chart with ConceptDraw using our tips. Here you can find an explanation of how to create a line chart quickly.- Draw Schematic Diagram For Pyramid Of Energy
- Pyramid Diagram and Pyramid Chart | Pyramid Diagram | Energy ...
- Pyramid Diagram and Pyramid Chart | Energy Pyramid Diagram ...
- Diagram of a Pyramid | How to Draw a Pyramid Diagram in ...
- Energy Pyramid Diagram | Energy resources diagram | Resources ...
- Draw The Diagrame Showing The Pyramid Of Energy
- Energy Pyramid Diagram | Electrical Drawing Software and ...
- How to Draw a Pyramid Diagram in ConceptDraw PRO | Energy ...
- How to Draw a Pyramid Diagram in ConceptDraw PRO | Basic ...
- Energy Pyramid Diagram | Chart Examples | Chart Templates ...
- Energy Pyramid Diagram | Diagram of a Pyramid | Pyramid Diagram ...
- Energy Pyramid Diagram | Diagram of a Pyramid | Pyramid Chart ...
- Easy Images Of Biomass Energy To Draw
- Energy Pyramid Diagram | Draw Fishbone Diagram on MAC ...
- Draw The Diagram Of The Different Source Of Energy
- Energy Pyramid Diagram | Pyramid Chart Maker | Pyramid Charts ...
- Resources and energy - Vector stencils library | Pyramid Diagram ...
- Energy Pyramid Diagram | Draw An Energy Pyramid Showing ...
- Draw Fishbone Diagram on MAC Software | Pyramid Chart ...
- Draw The Diagram Of The Diffrent Source Of Energy


