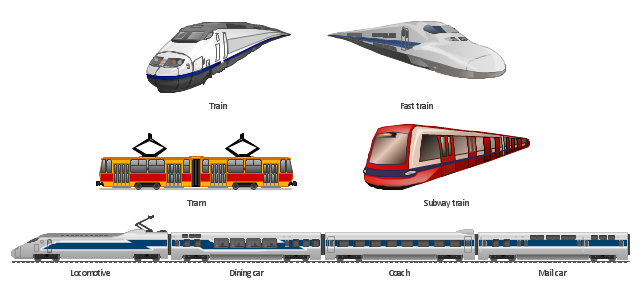
The vector clipart library Rail transport contains 8 images: railway train, fast train, subway train, tram, locomotive, dining car, coach, mail car.
Use the vector stencils library Rail transport to draw train illustrations, presentation slides, infographics and diagrams using the ConceptDraw PRO diagramming and vector drawing software.
"Rail transport is a means of conveyance of passengers and goods, by way of wheeled vehicles running on rails. It is also commonly referred to as train transport. In contrast to road transport, where vehicles merely run on a prepared surface, rail vehicles are also directionally guided by the tracks on which they run. Track usually consists of steel rails installed on sleepers/ ties and ballast, on which the rolling stock, usually fitted with metal wheels, moves. However, other iations are also possible, such as slab track where the rails are fastened to a concrete foundation resting on a prepared subsurface. Rolling stock in railway transport systems generally has lower frictional resistance when compared with highway vehicles and the passenger and freight cars (carriages and wagons) can be coupled into longer trains. The operation is carried out by a railway company, providing transport between train stations or freight customer facilities. Power is provided by locomotives which either draw electrical power from a railway electrification system or produce their own power, usually by diesel engines. Most tracks are accompanied by a signalling system. Railways are a safe land transport system when compared to other forms of transport." [Rail transport. Wikipedia]
The design elements library Rail transport is included in the Aerospace and Transport solution from the Illustration area of ConceptDraw Solution Park.
Vector clip art
Design Pictorial Infographics. Design Infographics

Bus Network Topology

 Event-driven Process Chain Diagrams
Event-Driven Process Chain Diagrams solution extends ConceptDraw DIAGRAM functionality with event driven process chain templates, samples of EPC engineering and modeling the business processes, and a vector shape library for drawing the EPC diagrams and EPC flowcharts of any complexity. It is one of EPC IT solutions that assist the marketing experts, business specialists, engineers, educators and researchers in resources planning and improving the business processes using the EPC flowchart or EPC diagram. Use the EPC solutions tools to construct the chain of events and functions, to illustrate the structure of a business process control flow, to describe people and tasks for execution the business processes, to identify the inefficient businesses processes and measures required to make them efficient.
Stakeholder Management System

 Website Wireframe
The innovative Website Wireframe solution enhances the ConceptDraw DIAGRAM functionality with newest wireframe tools, libraries with variety of predesigned icons, symbols, buttons, graphics, forms, boxes, and many other vector elements, templates and professionally designed samples, which make it the best wireframing software. Website Wireframe solution gives you significant advantages when designing and maintaining websites, creating skeletal and content-free depictions of website structure, making website prototypes and planning the content arrangement before committing to design, also speeds up the processes of sketching, producing and sharing wireframe examples of website style and interface design.
Drawing Illustration

UML Use Case Diagram Example. Registration System

Cisco Routers. Cisco icons, shapes, stencils and symbols

 Fault Tree Analysis Diagrams
This solution extends ConceptDraw DIAGRAM.5 or later with templates, fault tree analysis example, samples and a library of vector design elements for drawing FTA diagrams (or negative analytical trees), cause and effect diagrams and fault tree diagrams.
 Project Management Area
Project Management area provides Toolbox solutions to support solving issues related to planning, tracking, milestones, events, resource usage, and other typical project management functions.
How To Create Emergency Plans and Fire Evacuation

 Histograms
How to make a Histogram? Making a Histogram is an incredibly easy process when it is done with ConceptDraw DIAGRAM. The Histograms Solution enhances ConceptDraw DIAGRAM functionality with extensive drawing tools, numerous samples, and examples; also a quick-start template and library of ready vector stencils for visualization the data and professional drawing Histograms.
- Diagram Of Diffferent Means Of Transportation
- Draw A Diagram Of Various Means Of Transportation
- How To Draw Flow Diagram Showing Means Of Transportation
- Pictures Of Flow Chart Depicting Different Means Of Transport
- Draw Diagram Means Of Transportation
- Simple Diagram Of Means Of Transportation
- Diagram Of Means Of Transportation
- Make A Flow Chart Depicting The Different Means Of Transport
- Draw Pictures Showing Different Means Of Transport
- Draw A Chart On Means Of Transport
- Show The Flowchart Of Means Of Transport
- Means Of Transport And Communication Easy Chart Drawing
- Means Of Transportation Diagram
- Make A Chart On Means Of Transport
- How To Draw Flowchart For Means Of Transport
- Diagrams Of Means Of Air Transport
- Diagrams That Illustrate The Means Of Transportation
- Means Of Transportation With Diagrams
- How To Draw Transport Chart
- Fishbone Diagram | Design elements - Aircraft | Transport ...