Process Flowchart


Flowchart Maker

Flow chart Example. Warehouse Flowchart


This IDEF3 diagram example was redesigned from the Wikimedia Commons file: 5-21 Completed Transition Schematic.jpg.
[commons.wikimedia.org/ wiki/ File:5-21_ Completed_ Transition_ Schematic.jpg]
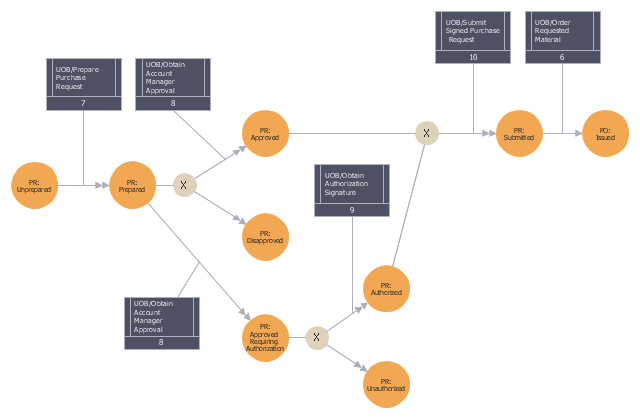
"As with the Process Schematic, the correctness of the Object Schematic and
associated elaborations are confirmed through validation with the domain expert. After reviewing the Transition Schematic, the domain expert observes that the allowable state transitions displayed in the schematic do not include those representative of a failed request. ...
The domain expert also identified transitions through which the identity of the object was preserved and transitions where the object was actually transformed into an entirely different object. The domain expert’s comments to the analyst yield the schematic
depicted in Figure 5-21." [IDEF3 Process Description Capture Method Report AL-TR-1995-XXXX. idef.com/ pdf/ Idef3_ fn.pdf]
The sample "Completed transition schematic - IDEF3 diagram" was created using the ConceptDraw PRO diagramming and vector drawing software extended with the solution "IDEF Business Process Diagrams" from the area "Business Processes" of ConceptDraw Solution Park.
[commons.wikimedia.org/ wiki/ File:5-21_ Completed_ Transition_ Schematic.jpg]
"As with the Process Schematic, the correctness of the Object Schematic and
associated elaborations are confirmed through validation with the domain expert. After reviewing the Transition Schematic, the domain expert observes that the allowable state transitions displayed in the schematic do not include those representative of a failed request. ...
The domain expert also identified transitions through which the identity of the object was preserved and transitions where the object was actually transformed into an entirely different object. The domain expert’s comments to the analyst yield the schematic
depicted in Figure 5-21." [IDEF3 Process Description Capture Method Report AL-TR-1995-XXXX. idef.com/ pdf/ Idef3_ fn.pdf]
The sample "Completed transition schematic - IDEF3 diagram" was created using the ConceptDraw PRO diagramming and vector drawing software extended with the solution "IDEF Business Process Diagrams" from the area "Business Processes" of ConceptDraw Solution Park.
IDEF3 business process diagram
Basic Diagramming


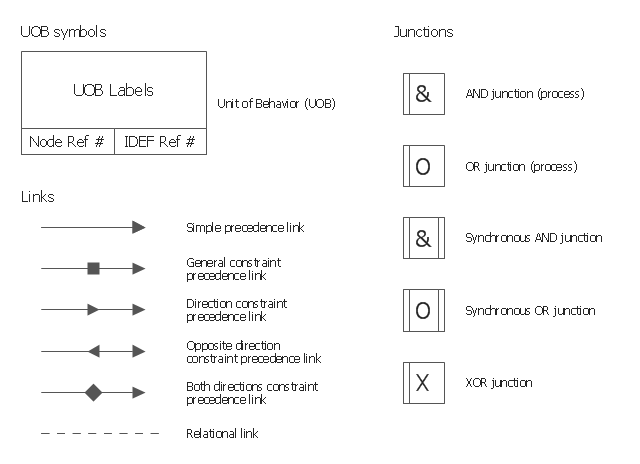
The vector stencils library "IDEF3 process schematic symbols" contains 12 shapes: unit of behavior (UOB), links, junctions, .
Use it to design your IDEF3 process schematic diagrams.
"Process schematics tend to be the most familiar and broadly used component of the IDEF3 method. These schematics provide a visualization mechanism for processcentered descriptions of a scenario. The graphical elements that comprise process schematics include Unit of Behavior (UOB) boxes, precedence links, junctions, referents, and notes. The building blocks here are:
- Unit of Behavior (UOB) boxes.
- Links: Links are the glue that connect UOB boxes to form representations of dynamic processes.
- Simple Precedence Links: Precedence links express temporal precedence relations between instances of one UOB and those of another.
- Activation Plots: Activation plots are used to represent activations.
- Dashed Links: Dashed links carry no predefined semantics.
- Link Numbers: All links have an elaboration and unique link numbers.
Activation Semantics for Nonbranching Process Schematics.
- Junctions: Junctions in IDEF3 provide a mechanism to specify the logic of process branching.
- UOB Decompositions: Elaborations capture and structure detailed knowledge about processes.
- UOB Reference Numbering Scheme: A UOB box number is assigned to each UOB box in an IDEF3 Process Description.
- Partial Descriptions: UOB boxes are joined together by links. Because of the description capture focus of IDEF3, it is possible to conceive of UOBs without links to other parts of an IDEF3 schematic.
- Referents: Referents enhance understanding, provide additional meaning, and simplify the construction (i.e., minimize clutter) of both process schematics and object schematics." [IDEF3. Wikipedia]
The shapes example "Design elements - IDEF3 process schematic symbols" was created using the ConceptDraw PRO diagramming and vector drawing software extended with the solution "IDEF Business Process Diagrams" from the area "Business Processes" of ConceptDraw Solution Park.
IDEF3 business process diagram
How To use House Electrical Plan Software


How to draw a Cross-Functional Flowchart

Electrical Drawing Software and Electrical Symbols

Cross-Functional Flowchart


Flowchart Software


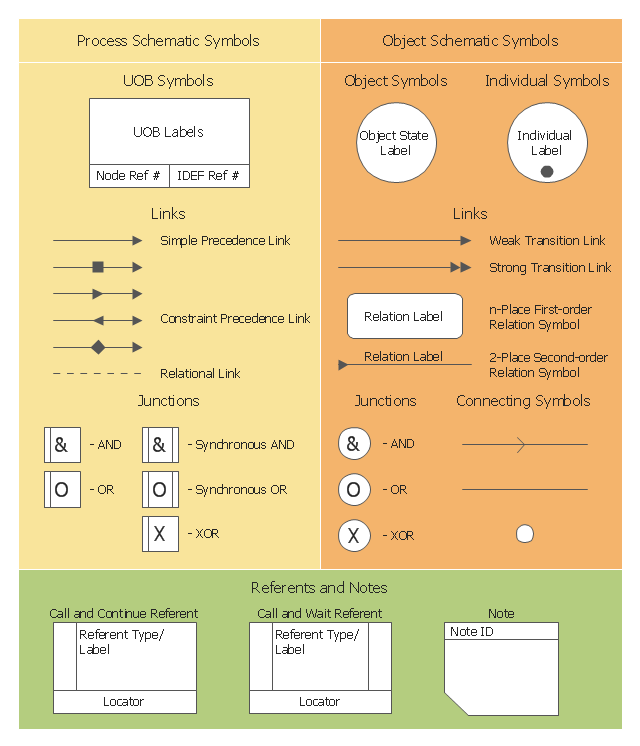
This IDEF3 symbols example was redesigned from the Wikimedia Commons file: 3-01a Symbols Used for IDEF3 Process Description Schematics.jpg.
[commons.wikimedia.org/ wiki/ File:3-01a_ Symbols_ Used_ for_ IDEF3_ Process_ Description_ Schematics.jpg]
"Process schematics tend to be the most familiar and broadly used component of the IDEF3 method. These schematics provide a visualization mechanism for process-centered descriptions of a scenario. The graphical elements that comprise process schematics include Unit of Behavior (UOB) boxes, precedence links, junctions, referents, and notes. Referents and notes are constructs that are common across process and object schematics. Each of the graphical elements used for developing process schematics is presented below, together with discussions of how to formulate more complex statements using those graphical elements. The discussion begins with the most fundamental of these building blocks: the UOB." [IDEF3 Process Description Capture Method Report AL-TR-1995-XXXX. idef.com/ pdf/ Idef3_ fn.pdf]
The sample "Symbols used for IDEF3 process description schematics" was created using the ConceptDraw PRO diagramming and vector drawing software extended with the solution "IDEF Business Process Diagrams" from the area "Business Processes" of ConceptDraw Solution Park.
IDEF3 diagram symbols
ERD Symbols and Meanings


Mechanical Drawing Software

- Draw N Explain Schematic Diagram Of A Program Execution
- Process Flowchart | Pyramid Diagram | Organogram Software | Draw ...
- Draw And Explain Schematic Diagram Of Program Execution
- Crude oil distillation unit - PFD | Process flow diagram (PFD ...
- Completed transition schematic - IDEF3 diagram | Transition ...
- Draw A Schematic Diagram On Process Of Communication
- IDEF3 Standard | How to create an IDEF3 diagram using ...
- With Block Diagram Explain The Steps Involved In Planning Process
- Schematic Diagram Showing Process State
- Schematic Diagram Of An Organization
- Process Flowchart | Pyramid Diagram | Types of Flowcharts ...
- Draw Schematic Production System
- Process Flowchart | Network Diagram Software LAN Network ...
- Electrical Symbols, Electrical Diagram Symbols | Process Flow ...
- How to Create a CCTV Diagram in ConceptDraw PRO | Amine ...
- Process Flowchart | Entity Relationship Diagram Symbols | Pyramid ...
- IDEF3 Standard | How to create an IDEF3 diagram using ...
- How to Create a CCTV Diagram in ConceptDraw PRO | Process ...
- Pyramid Diagram | Pyramid Diagram | Process Flowchart | Chart Of ...
- 4 Level pyramid model diagram - Information systems types ...