This Water cycle diagram example was drawn using the ConceptDraw PRO diagramming and vector graphics software extended with the clipart libraries Geography and Weather.
"The water cycle, also known as the hydrologic cycle or the H2O cycle, describes the continuous movement of water on, above and below the surface of the Earth. The mass water on Earth remains fairly constant over time but the partitioning of the water into the major reservoirs of ice, fresh water, saline water and atmospheric water is variable depending on a wide range of climatic variables. The water moves from one reservoir to another, such as from river to ocean, or from the ocean to the atmosphere, by the physical processes of evaporation, condensation, precipitation, infiltration, runoff, and subsurface flow. In so doing, the water goes through different phases: liquid, solid (ice), and gas (vapor)." [Water cycle. Wikipedia]
This water cycle diagram example is included in the Nature solution from the Illustration area of ConceptDraw Solution Park.
Vector illustration

Pyramid Diagram

Wireless Network Elements

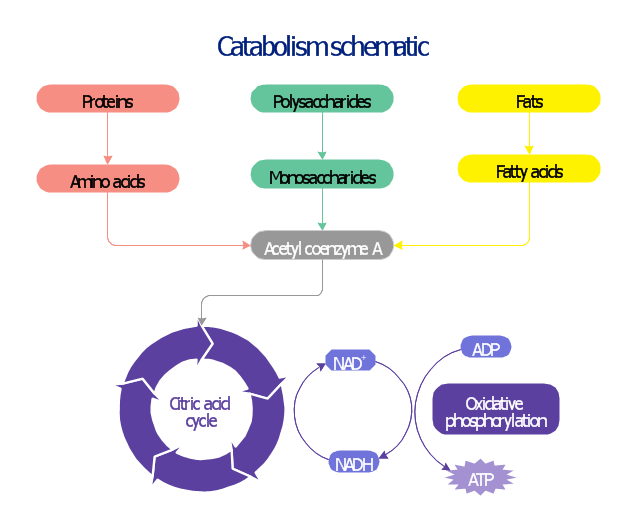
This biochemical chart display how proteins, polysaccharides and fats from food are digested into gastrointestinal tract into aminoacids, monosaccharides and fatty acids, and then broken down and oxidized to carbon dioxide and water in cellular processes of energy generation.
This metabolic pathway map was redesigned from Wikipedia file: Catabolism schematic.svg. [en.wikipedia.org/ wiki/ File:Catabolism_ schematic.svg]
The biochemical diagram example "Catabolism schematic" was created using the ConceptDraw PRO diagramming and vector drawing software extended with the Biology solution from the Science and Education area of ConceptDraw Solution Park.
Catabolic pathway map
Flowchart Components

Types of Flowcharts


BPR Diagram. Business Process Reengineering Example

Pyramid Diagram

This arrow loop diagram sample was created on the base of the figure illustrating the webpage "Safe Roads for a Safer Future A Joint Safety Strategic Plan" from the website of US Department of Transportation - Federal Highway Administration (FHWA) Office of Safety.
"STRATEGIC PLANNING CYCLE.
After the safety units issue the SSP, they will identify and prioritize strategies to support the established goals. Many strategies will originate in existing roadmaps or in other program planning activities. The safety units will also use this information when developing their Unit Performance Plans and individual performance plans. Teams within each safety unit will carry out projects and activities to support identified strategies and achieve the SSP goals.
The SSP process also includes continuous performance monitoring and evaluation through which the safety units will review past accomplishments against the established goals, consider how well strategies are implemented, assess progress toward goals, identify risks, consider changes in the environment, and discuss future strategic direction. As a part of the evaluation process, the three safety units will recognize achievements and discuss the need for adjustments. Figure ... shows the strategic planning cycle.
The safety units will update the SSP every 3 to 5 years using input from a variety of sources, including evaluations, safety trends, and legislative changes." [safety.fhwa.dot.gov/ ssp/ ]
The arrow loop diagram example "Strategic planning cycle" was created using the ConceptDraw PRO diagramming and vector drawing software extended with the Target and Circular Diagrams solution from the Marketing area of ConceptDraw Solution Park.
www.conceptdraw.com/ solution-park/ marketing-target-and-circular-diagrams
Arrow loop diagram
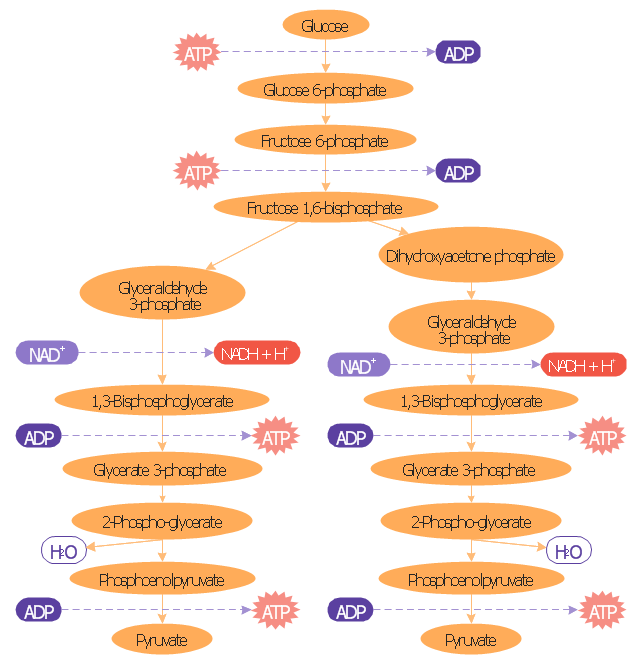
"Glycolysis is the metabolic pathway that converts glucose into pyruvate. The free energy released in this process is used to form the high-energy compounds ATP (adenosine triphosphate) and NADH (reduced nicotinamide adenine dinucleotide)." [Glycolysis. Wikipedia]
This biochemical diagram was redesigned from Wikimedia file: Glycolysis overview.svg. [commons.wikimedia.org/ wiki/ File:Glycolysis_ overview.svg]
The glucose metabolism diagram example "Glycolysis overview" was created using the ConceptDraw PRO diagramming and vector drawing software extended with the Biology solution from the Science and Education area of ConceptDraw Solution Park.
Glycolysis pathway map
Metropolitan area networks (MAN). Computer and Network Examples
. Computer and Network Examples")

 School and Training Plans
School and Training Plans solution enhances ConceptDraw DIAGRAM functionality with extensive drawing tools, numerous samples and examples, templates and libraries of classroom design elements for quick and professional drawing the School and Training plans, School Floor plans, Classroom Layout, Classroom Seating chart, Lecture Room plans of any complexity. Each offered classroom seating chart template is a real help for builders, designers, engineers, constructors, as well as teaching personnel and other teaching-related people in drawing Classroom Seating charts and Training Room layouts with ConceptDraw DIAGRAM classroom seating chart maker.
The vector stencils library "Citric acid cycle (TCA cycle)" contains 26 symbols of metabolites for drawing metabolic pathway maps and biochemical shematic diagrams of the citric acid cycle (TCA cycle, tricarboxylic acid cycle, Krebs cycle) and diagrams of metabolism processes.
"The citric acid cycle - also known as the tricarboxylic acid cycle (TCA cycle), or the Krebs cycle, - is a series of chemical reactions used by all aerobic organisms to generate energy through the oxidation of acetate derived from carbohydrates, fats and proteins into carbon dioxide and chemical energy in the form of adenosine triphosphate (ATP). In addition, the cycle provides precursors of certain amino acids as well as the reducing agent NADH that is used in numerous other biochemical reactions. Its central importance to many biochemical pathways suggests that it was one of the earliest established components of cellular metabolism and may have originated abiogenically.
The name of this metabolic pathway is derived from citric acid (a type of tricarboxylic acid) that is consumed and then regenerated by this sequence of reactions to complete the cycle. In addition, the cycle consumes acetate (in the form of acetyl-CoA) and water, reduces NAD+ to NADH, and produces carbon dioxide as a waste byproduct. The NADH generated by the TCA cycle is fed into the oxidative phosphorylation (electron transport) pathway. The net result of these two closely linked pathways is the oxidation of nutrients to produce usable chemical energy in the form of ATP." [Citric acid cycle. Wikipedia]
The shapes example "Design elements - TCA cycle" is included in the Biology solution from the Science and Education area of ConceptDraw Solution Park.
Tricarboxylic acid cycle (Krebs cycle) symbols
-symbols--design-elements---tca-cycle.png--diagram-flowchart-example.png)
 Workflow Diagrams
Workflow Diagrams solution extends ConceptDraw DIAGRAM software with samples, templates and vector stencils library for drawing the work process flowcharts.
Star Network Topology


Concept Map

Baseball Diagram — Defence Positions

When To Use a Fishbone Diagram

Diagrams Mean Nothing

 Target and Circular Diagrams
This solution extends ConceptDraw DIAGRAM software with samples, templates and library of design elements for drawing the Target and Circular Diagrams.
- Water cycle diagram | Drawing a Nature Scene | Drawing Illustration ...
- With The Aid Of Well Labelled Diagram Discuss The Project Life Cycle
- Different Sanitary Fittings In A Building With Diagram
- Water cycle diagram | Drawing a Nature Scene | Draw Flowcharts ...
- Water cycle diagram | Circular arrows diagram - PDCA cycle ...
- Water cycle diagram | Drawing a Nature Scene | Beauty in nature ...
- Process Flowchart | Water Cycle Diagram Well Labelled
- Mechanical Engineering | With The Aid Of A Diagram Draw A Water ...
- Describe The Water Cycle Using An Annoted Diagram
- Drawing a Nature Scene | Nature | Draw The Schematic Diagram Of ...
- Drawing Illustration | Drawing a Nature Scene | Beauty in nature ...
- Determine groundwater - IDEF0 diagram | Automated payroll ...
- Proton-proton chain reaction diagram | BPR Diagram . Business ...
- Innovation life cycle - Arrow loop diagram | Drawing Illustration ...
- Discuss The Biochemical Path Way Of Svg
- Draw The Illustrate The Water Cycle Then Explain
- Process Flowchart | Network Diagram Software LAN Network ...
- 4 Level pyramid model diagram - Information systems types | With ...
- With The Aid Of Diagram Explain Glycolysis Process