Business Processes description with ConceptDraw DIAGRAM

Flowchart Symbols AccountingActivity-based costing (ABC) flowchart
 flowchart")
Types of Flowcharts


Electrical Symbols — Electron Tubes

Process Flowchart


IDEF9 Standard

Business Processes

Sample Pictorial Chart. Sample Infographics

Object-Oriented Design

Sentence Diagrammer

"Most methods of diagramming in pedagogy are based on the work of Alonzo Reed and Brainerd Kellogg in their book Higher Lessons in English, first published in 1877, though the method has been updated with recent understanding of grammar. ...
Some schoolteachers continue to use the Reed-Kellogg system in teaching grammar, but others have discouraged it in favor of more modern tree diagrams. However, these modern tree structures draw on techniques that were already present in Reed-Kellogg diagrams. Reed and Kellogg defend their system in the preface to their grammar:
The Objections to the Diagram.--The fact that the pictorial diagram groups the parts of a sentence according to their offices and relations, and not in the order of speech, has been spoken of as a fault. It is, on the contrary, a merit, for it teaches the pupil to look through the literary order and discover the logical order. He thus learns what the literary order really is, and sees that this may be varied indefinitely, so long as the logical relations are kept clear.
The assertion that correct diagrams can be made mechanically is not borne out by the facts. It is easier to avoid precision in oral analysis than in written. The diagram drives the pupil to a most searching examination of the sentence, brings him face to face with every difficulty, and compels a decision on every point.
... Reed-Kellogg diagrams abstract away from actual word order in order to focus more intently on how words in sentences function and relate to each other.
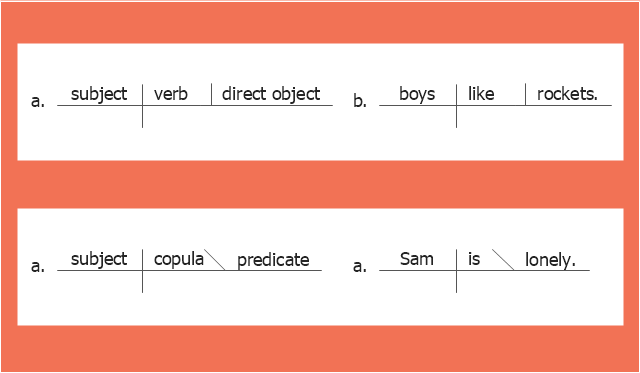
The Reed-Kellogg System. Simple sentences in the Reed-Kellogg system are diagrammed in accordance with the ... basic schemata" shown in this diagram example. [Sentence diagram. Wikipedia]
The example "The Reed-Kellogg system - Basic schemata" was created using the ConceptDraw PRO diagramming and vector drawing software extended with the Language Learning solution from the Science and Education area of ConceptDraw Solution Park.
Some schoolteachers continue to use the Reed-Kellogg system in teaching grammar, but others have discouraged it in favor of more modern tree diagrams. However, these modern tree structures draw on techniques that were already present in Reed-Kellogg diagrams. Reed and Kellogg defend their system in the preface to their grammar:
The Objections to the Diagram.--The fact that the pictorial diagram groups the parts of a sentence according to their offices and relations, and not in the order of speech, has been spoken of as a fault. It is, on the contrary, a merit, for it teaches the pupil to look through the literary order and discover the logical order. He thus learns what the literary order really is, and sees that this may be varied indefinitely, so long as the logical relations are kept clear.
The assertion that correct diagrams can be made mechanically is not borne out by the facts. It is easier to avoid precision in oral analysis than in written. The diagram drives the pupil to a most searching examination of the sentence, brings him face to face with every difficulty, and compels a decision on every point.
... Reed-Kellogg diagrams abstract away from actual word order in order to focus more intently on how words in sentences function and relate to each other.
The Reed-Kellogg System. Simple sentences in the Reed-Kellogg system are diagrammed in accordance with the ... basic schemata" shown in this diagram example. [Sentence diagram. Wikipedia]
The example "The Reed-Kellogg system - Basic schemata" was created using the ConceptDraw PRO diagramming and vector drawing software extended with the Language Learning solution from the Science and Education area of ConceptDraw Solution Park.
Sentence diagram
 IDEF Business Process Diagrams
The IDEF Business Process Diagrams solution can help the ConceptDraw DIAGRAM users create the needed IDEF business process diagrams by providing them with useful drawing tools, the stencils meaning the design symbols including the connectors, IDEF design elements. These tools help users to create the great looking business process diagrams based on the IDEF methodology, effective database designs and object-oriented designs, following the integration definition methodology. Being suitable for any user who needs to capture or to record different business processes and the system architecture, IDEF Business Process Diagrams solution is useful for many IT specialists, computer specialists, network and telecommunication engineers, IT managers, software engineers, system administrators, webmasters, system architects, and system engineers, etc.
 Astronomy
To simplify the work of drawing, the Astronomy solution may be used as an extension to the ConceptDraw DIAGRAM application. The last-mentioned sketching and illustration software may be used with the Astronomy solution allowing one to create the astronomy-related drawings by editing the pre-made templates and samples of the illustrations of the Space. There are also a few stencil libraries where a variety of astronomy symbols such as constellations, stars, planet and galaxies vector shapes may be found. The Astronomy solution may be used by all the ConceptDraw DIAGRAM users for drawing both educational and scientific astronomy illustrations, astronomy diagrams and pictures of any complexity, such as the representations of the Solar System.
Soccer (Football) Offside
 Offside *")
 Sales Dashboard
Sales Dashboard solution extends ConceptDraw DIAGRAM software with templates, samples and library of vector stencils for drawing the visual dashboards of sale metrics and key performance indicators (KPI).
Design Element: Crows Foot for Entity Relationship Diagram - ERD

 Stakeholder Onion Diagrams
The Stakeholder Onion Diagrams solution supplies ConceptDraw DIAGRAM with powerful tools to simplify the process of creating Stakeholder Onion Diagrams. It includes the set of pre-made vector objects and templates for a quick start, and collection of examples illustrating the solution's power. This solution is useful for all specialists in management and business, especially for those who prefer to use the newest progressive tools.
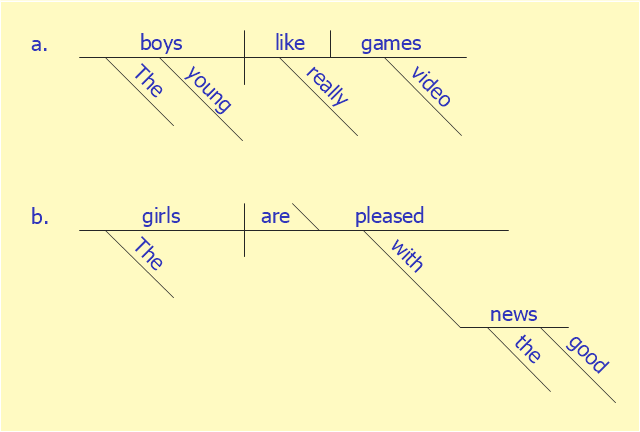
This sentence diagram example was redesigned from the Wikipedia file: Examples of Reed-Kellogg diagrams.jpg.
[en.wikipedia.org/ wiki/ File:Examples_ of_ Reed-Kellogg_ diagrams.jpg]
This file is licensed under the Creative Commons Attribution-Share Alike 3.0 Unported license. [creativecommons.org/ licenses/ by-sa/ 3.0/ deed.en]
"Most methods of diagramming in pedagogy are based on the work of Alonzo Reed and Brainerd Kellogg in their book Higher Lessons in English, first published in 1877, though the method has been updated with recent understanding of grammar. Reed and Kellogg were preceded, and their work probably informed, by W. S. Clark, who published his "balloon" method of depicting grammar in his 1847 book A Practical Grammar: In Which Words, Phrases & Sentences are Classified According to Their Offices and Their Various Relationships to Each Another.
Some schoolteachers continue to use the Reed-Kellogg system in teaching grammar, but others have discouraged it in favor of more modern tree diagrams. However, these modern tree structures draw on techniques that were already present in Reed-Kellogg diagrams. Reed and Kellogg defend their system in the preface to their grammar:
The Objections to the Diagram. - The fact that the pictorial diagram groups the parts of a sentence according to their offices and relations, and not in the order of speech, has been spoken of as a fault. It is, on the contrary, a merit, for it teaches the pupil to look through the literary order and discover the logical order. He thus learns what the literary order really is, and sees that this may be varied indefinitely, so long as the logical relations are kept clear.
The assertion that correct diagrams can be made mechanically is not borne out by the facts. It is easier to avoid precision in oral analysis than in written. The diagram drives the pupil to a most searching examination of the sentence, brings him face to face with every difficulty, and compels a decision on every point.
These statements bear witness to the fact that Reed-Kellogg diagrams abstract away from actual word order in order to focus more intently on how words in sentences function and relate to each other." [Sentence diagram. Wikipedia]
The examples of Reed-Kellogg diagrams was created using the ConceptDraw PRO diagramming and vector drawing software extended with the Language Learning solution from the Science and Education area of ConceptDraw Solution Park.
Sentence diagram
This sentence diagram sample was createb on the base of the webpage "Diagramming Sentences" from the website of the Capital Community College, Hartford CT. [grammar.ccc.commnet.edu/ grammar/ diagrams2/ one_ pager2.htm]
"In grammar, clause structure refers to the classification of sentences based on the number and kind of clauses in their syntactic structure. Such division is an element of traditional grammar.
A simple sentence consists of only one clause. A compound sentence consists of two or more independent clauses. A complex sentence has at least one independent clause plus at least one dependent clause.
A sentence consisting of one or more dependent clauses plus two or more independent clauses may be called a complex-compound sentence or compound-complex sentence. ...
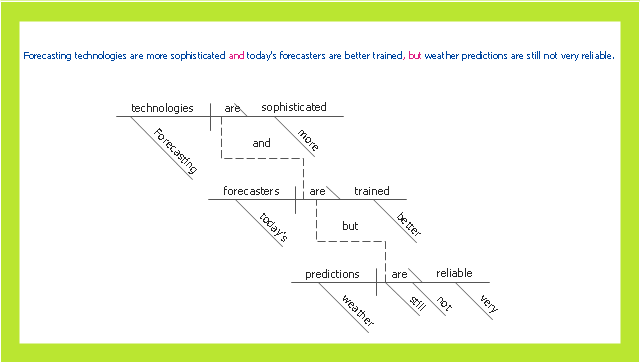
A compound sentence is composed of at least two independent clauses. It does not require a dependent clause. The clauses are joined by a coordinating conjunction (with or without a comma), a semicolon that functions as a conjunction, a colon instead of a semicolon between two sentences when the second sentence explains or illustrates the first sentence and no coordinating conjunction is being used to connect the sentences, or a conjunctive adverb preceded by a semicolon. A conjunction can be used to make a compound sentence. Conjunctions are words such as for, and, nor, but, or, yet, so (the first letters of which spell "fanboys"). The use of a comma to separate two independent clauses without the addition of an appropriate conjunction is called a comma splice and is generally considered an error (when used in the English language)." [Sentence clause structure. Wikipedia]
The example "Compound sentence" was created using the ConceptDraw PRO diagramming and vector drawing software extended with the Language Learning solution from the Science and Education area of ConceptDraw Solution Park.
"In grammar, clause structure refers to the classification of sentences based on the number and kind of clauses in their syntactic structure. Such division is an element of traditional grammar.
A simple sentence consists of only one clause. A compound sentence consists of two or more independent clauses. A complex sentence has at least one independent clause plus at least one dependent clause.
A sentence consisting of one or more dependent clauses plus two or more independent clauses may be called a complex-compound sentence or compound-complex sentence. ...
A compound sentence is composed of at least two independent clauses. It does not require a dependent clause. The clauses are joined by a coordinating conjunction (with or without a comma), a semicolon that functions as a conjunction, a colon instead of a semicolon between two sentences when the second sentence explains or illustrates the first sentence and no coordinating conjunction is being used to connect the sentences, or a conjunctive adverb preceded by a semicolon. A conjunction can be used to make a compound sentence. Conjunctions are words such as for, and, nor, but, or, yet, so (the first letters of which spell "fanboys"). The use of a comma to separate two independent clauses without the addition of an appropriate conjunction is called a comma splice and is generally considered an error (when used in the English language)." [Sentence clause structure. Wikipedia]
The example "Compound sentence" was created using the ConceptDraw PRO diagramming and vector drawing software extended with the Language Learning solution from the Science and Education area of ConceptDraw Solution Park.
Sentence diagram
Matrix Organization

- Verbs Flow Chart Along With Direct Indirect
- Language Learning | Flow Chart On Direct Indirect Sentence
- <div> Flowchart Symbols Accounting</div>Activity-based costing ...
- Business Processes description with ConceptDraw DIAGRAM ...
- How to Diagram Sentences in ConceptDraw PRO | Bio Flowchart ...
- IDEF0 Flowchart Symbols | Example Of Flow Chart Using Verb
- Sentence diagram | Sentence diagram | Direct Object Examples
- Computer peripheral devices - Vector stencils library | Mouse Control
- Project — Working With Costs | ConceptDraw DIAGRAM ...
- Business Processes description with ConceptDraw PRO | IDEF9 ...