Software Work Flow Process in Project Management with Diagram

This sample shows the Workflow Diagram that clearly illustrates stages a BPM consists of and relations between all parts of business. The Workflow Diagrams are used to represent the transferring of data during the work process, to study and analysis the working processes, and to optimize a workflow.
Types of Flowcharts


Use a Fishbone Diagram to Attack Complex Problems

UML Class Diagram Tutorial

Diagramming Software for Design UML Package Diagrams


Affinity Diagram

UML Diagram for System

Network Diagram Software. LAN Network Diagrams. Physical Office Network Diagrams


Data Flow Diagram

Total Quality Management Density

BPR Diagram. Business Process Reengineering Example

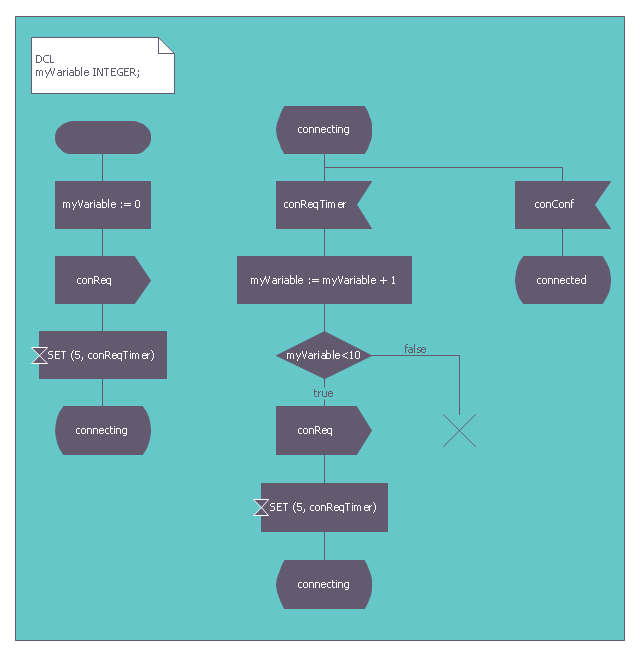
This finite state machine diagram example was redesigned from the Wikimedia Commons file: SdlStateMachine.png. [commons.wikimedia.org/ wiki/ File:SdlStateMachine.png]
This file is licensed under the Creative Commons Attribution-Share Alike 3.0 Unported license. [creativecommons.org/ licenses/ by-sa/ 3.0/ deed.en]
"Behavior.
Each process agent is a state machine that contributes to the action carried out by the system. A message stimulus coming from the environment or from another agent to an agent is called a signal. Signals received by a process agent are first placed in a queue (the input port). When the state machine is waiting in a state, if the first signal in the input port is enabled for that state it starts a transition leading to another state. Transitions can output signals to other agents or to the environment. A process agent is allowed to contain procedure types so that the same actions can be invoked from different places. It is also allowed to call a remote procedure type to invoke a procedure in another agent (or even another system) and wait for a response." [Specification and Description Language. Wikipedia]
The example "SDL diagram - State Machine" was created using the ConceptDraw PRO diagramming and vector drawing software extended with the Specification and Description Language (SDL) solution from the Engineering area of ConceptDraw Solution Park.
Finite state machine
Used Solutions
Personal area (PAN) networks. Computer and Network Examples
 networks")
Object-Oriented Design

Software development with ConceptDraw products

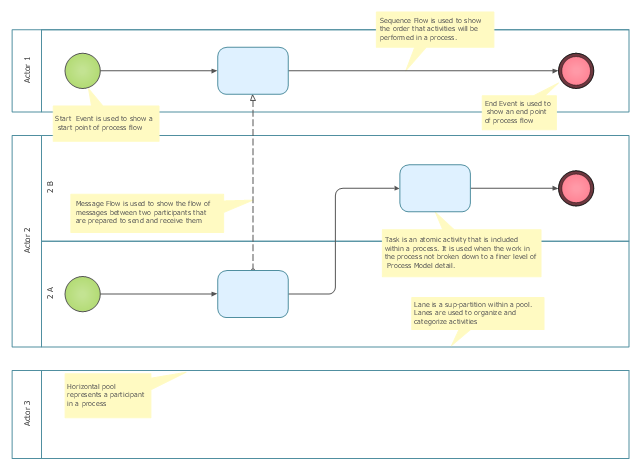
"A swim lane (or swimlane) is a visual element used in process flow diagrams, or flowcharts, that visually distinguishes responsibilities for sub-processes of a business process. Swim lanes may be arranged either horizontally or vertically. In the accompanying example, the swimlanes are named Customer, Sales, Contracts, Legal, and Fulfillment, and are arranged vertically. ...
When used to diagram a business process that involves more than one department, swimlanes often serve to clarify not only the steps and who is responsible for each one, but also how delays, mistakes or cheating are most likely to occur.
Many process modeling methodologies utilize the concept of swimlanes, as a mechanism to organize activities into separate visual categories in order to illustrate different functional capabilities or responsibilities (organisational roles). Swimlanes are used in Business Process Modeling Notation (BPMN) and Unified Modeling Language activity diagram modeling methodologies." [Swim lane. Wikipedia]
The template "Business process swim lane diagram BPMN 1.2" for the ConceptDraw PRO diagramming and vector drawing software is included in the Business Process Diagram solution from the Business Processes area of ConceptDraw Solution Park.
Swim lane diagram BPMN 1.2 template
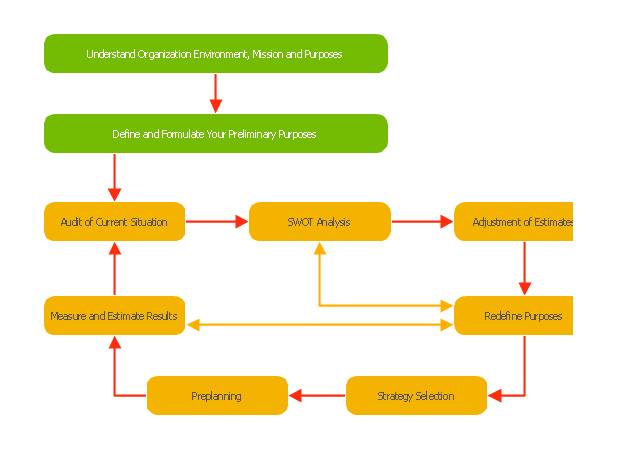
"Planning (also called forethought) is the process of thinking about and organizing the activities required to achieve a desired goal.
Planning involves the creation and maintenance of a plan. As such, planning is a fundamental property of intelligent behavior. This thought process is essential to the creation and refinement of a plan, or integration of it with other plans; that is, it combines forecasting of developments with the preparation of scenarios of how to react to them.
An important, albeit often ignored aspect of planning, is the relationship it holds with forecasting. Forecasting can be described as predicting what the future will look like, whereas planning predicts what the future should look like. The counterpart to planning is spontaneous order." [Planning. Wikipedia]
The block diagram example "Planning process" was created using the ConceptDraw PRO diagramming and vector drawing software extended with the Block Diagrams solution from the area "What is a Diagram" of ConceptDraw Solution Park.
Block diagram
A five level pyramid model of different types of Information Systems based on the information processing requirement of different levels in the organization. The first level represents transaction processing systems to process basic data. The second level represents office support systems to process information in office. The third level represents management information systems to process information by managers. The fourth level represents decision support systems to process explicit knowledge. The fifth level represents executive information systems to process tacit knowledge.
"A Computer(-Based) Information System is essentially an IS using computer technology to carry out some or all of its planned tasks. The basic components of computer based information system are:
(1) Hardware - these are the devices like the monitor, processor, printer and keyboard, all of which work together to accept, process, show data and information.
(2) Software - are the programs that allow the hardware to process the data.
(3) Databases - are the gathering of associated files or tables containing related data.
(4) Networks - are a connecting system that allows diverse computers to distribute resources.
(5) Procedures - are the commands for combining the components above to process information and produce the preferred output.
The first four components (hardware, software, database and network) make up what is known as the information technology platform. Information technology workers could then use these components to create information systems that watch over safety measures, risk and the management of data. These actions are known as information technology services." [Information systems. Wikipedia]
This pyramid diagram was redesigned using the ConceptDraw PRO diagramming and vector drawing software from Wikimedia Commons file Five-Level-Pyramid-model.png. [commons.wikimedia.org/ wiki/ File:Five-Level-Pyramid-model.png]
This file is licensed under the Creative Commons Attribution 3.0 Unported license. [creativecommons.org/ licenses/ by/ 3.0/ deed.en]
The triangle chart example "Information systems types" is included in the Pyramid Diagrams solution from the Marketing area of ConceptDraw Solution Park.
Pyramid diagram

The vector stencils library "Workflow diagrams" contains 54 symbol icons of workflow diagrams.
Use these clipart to represent information flow, automation of business processes, business process re-engineering, accounting, management, and human resources tasks in industry, business, and manufacturing.
"The term workflow is more commonly used in particular industries, such as printing and professional domains, where it may have particular specialized meanings.
(1) Processes: A process is a more general notion than workflow and can apply to physical or biological processes, for instance; whereas a workflow is typically a process or collection of processes described in the context of work, such as all processes occurring in a machine shop.
(2) Planning and scheduling: A plan is a description of the logically necessary, partially ordered set of activities required to accomplish a specific goal given certain starting conditions. A plan, when augmented with a schedule and resource allocation calculations, completely defines a particular instance of systematic processing in pursuit of a goal. A workflow may be viewed as an (often optimal or near-optimal) realization of the mechanisms required to execute the same plan repeatedly.
(3) Flow control is a control concept applied to workflows, to distinguish from static control of buffers of material or orders, to mean a more dynamic control of flow speed and flow volumes in motion and in process. Such orientation to dynamic aspects is the basic foundation to prepare for more advanced job shop controls, such as just-in-time or just-in-sequence.
(4) In-transit visibility is a monitoring concept that applies to transported material as well as to work in process or work in progress, i.e., workflows." [Workflow. Wikipedia]
The example "Workflow diagram - Business" was drawn using the ConceptDraw PRO diagramming and vector drawing software extended with the Workflow Diagrams solution from the Business Processes area of ConceptDraw Solution Park.
Business - Work flow chart

Diagramming tool - Amazon Web Services and Cloud Computing Diagrams

- Schematic Diagram On Process Of Communicaation
- Process Flow Digram Xls
- Process Production Flows Digram
- Process Flowchart | Draw The Water Cycle And Digram
- Entity-Relationship Diagram (ERD) | Process Flowchart | PM ...
- Decision Making | PDPC | Risk Diagram ( Process Decision Program ...
- Block Diagram
- Types of Flowcharts | How to Create a Fault Tree Analysis Diagram ...
- Data Flow Diagram Symbols. DFD Library
- Process Flowchart | Identifying Quality Management System ...
- Process Flowchart | Basic Flowchart Symbols and Meaning | Basic ...
- Process Flowchart | Data Flow Diagram Software | Taxi Booking Dfd ...
- Entity-Relationship Diagram (ERD) | Process Flowchart | Sports ...
- Flowchart Marketing Process . Flowchart Examples | Examples of ...
- Business Process Reengineering Block Digram Management Related
- ConceptDraw Solution Park | Process Used To Digram Of Electrical ...
- Business diagrams & Org Charts with ConceptDraw DIAGRAM ...
- Market Management Process Digram
- Block diagram - Planning process | Create Block Diagram | The ...