Entity Relationship Diagram Symbols
The semantic modeling method nowadays is successfully applied in database structure design. It is effective method of modeling the data structures, which is based on the meaning of these data. As a tool of semantic modeling, there are used different types of Entity-Relationship Diagrams. Entity Relationship Diagram (ERD) is applied to visually and clearly represent a structure of a business database. The main components of ERDs are: entity, relation and attributes. An entity is a class of similar objects in the model, each entity is depicted in the form of rectangle and has the name expressed by a noun. Relation is shown in the form of non-directional line that connects two entities. There are several notation styles used for ERDs: information engineering style, Chen style, Bachman style, Martin Style. The Entity Relationship Diagram symbols used for professional ERD drawing are predesigned by professionals and collected in the libraries of the Entity-Relationship Diagram (ERD) solution for ConceptDraw DIAGRAM software.ConceptDraw DIAGRAM ER Diagram Tool
Entity-relationship model, also called ER-model, is the main tool of domain modeling on the stage of conceptual design. The modeling of domain data structures is based on the use of graphical tools - Entity-Relationship diagrams (ER-diagrams). The core concepts of ER-Diagram are entity, attribute and relationship. ER-diagram lets visually represent the entities, helps effectively document all properties of designed system and to detail the data storages. To represent the elements at ER-model are commonly used Chen’s notation and Crow’s foot notation, each has its pros and cons. The entity on ER-diagram is represented in the form of rectangle, which specifies its name. An attribute is a property of the entity and relationship is an interaction between the entities. The relationship between two entities is called binary, between more than two entities - ternary. Specific software, such as ConceptDraw DIAGRAM with Entity-Relationship Diagram (ERD) solution from ConceptDraw Solution Park is helpful for easy creation Entity-Relationship Diagrams.ConceptDraw DIAGRAM Database Modeling Software
ConceptDraw DIAGRAM is a very easy-to-use and intuitive database design tool which can save you hundreds of work hours. See database diagram samples created with ConceptDraw DIAGRAM database modeling database diagram software."Crow's Foot notation is used in Barker's Notation, SSADM and Information Engineering. Crow's Foot diagrams represent entities as boxes, and relationships as lines between the boxes. Different shapes at the ends of these lines represent the cardinality of the relationship." [Entity–relationship model. Wikipedia]
The vector stencils library ERD, crow's foot notation contains 18 symbols for creating the ER-diagrams using the ConceptDraw PRO diagramming nd vector drawing software.
The example"Design elements - ERD solution (crow's foot notation)" is included in the Entity-Relationship Diagram (ERD) solution from the Software Development area of ConceptDraw Solution Park.
ConceptDraw Arrows10 Technology
You can see that when you rotate a group, connectors change their angle, keeping their position inside of the grouped objects. If you decide to ungroup the objects, the connectors will adjust to keep lines parallel to the edges of the sheet. The magic of ConceptDraw Arrows10’s rotating group containing connectors, makes complex diagramming simple and easy. The way to connect objects has never been easier.Data Flow Diagram Symbols. DFD Library
Data Flow Diagrams graphically represent the information transfers and process steps of a system. They visually depict how data are processed by a system in terms of inputs and outputs, how occurs the input in a system, how the data flow through an information system and where they are stored, and how occurs output from the system. DFDs give the overview of the system and models the processes aspects, they are maintained with other methods of structured systems analysis. The main goal of DFDs is achievement of understanding between developers and users. For their construction are used two notations - Gane-Sarson and Yourdon, each of them uses its own set of symbols. Data Flow Diagrams solution from Software Development area extends the ConceptDraw DIAGRAM software with templates, samples, and predesigned libraries of data flow diagram symbols for both notations, allowing you easy design the process-oriented and data-oriented models, draw the Data Flow Diagrams, Data Flowcharts, Data Process Diagrams, Information Flow Diagrams, Structured Analysis Diagrams, etc.How To Draw a Diagram
Is it possible to draw a diagram as quickly as the ideas come to you? The innovative ConceptDraw Arrows10 Technology included in ConceptDraw DIAGRAM is a simple and powerful tool to create any type of diagram. You mau choose to start from one of plenty diagram templates or to use your own idea.Object-Oriented Design
ConceptDraw DIAGRAM is a powerful diagramming and vector drawing software. Now, extended with IDEF Business Process Diagrams solution from the Business Processes area of ConceptDraw Solution Park it is incredibly helpful and convenient for object-oriented design.Database Flowchart Symbols
Data base diagrams describes inter-related data and tables. It describes roles and relationships, internal and external dependencies, data exchange conventions and structures of knowledge domain. ConceptDraw Software provides number of data-base chart libraries including major 49 vector symbols. Use these DFD flowchart symbol libraries to design data-base structure and models, use it to design data base process-oriented models, or simple data-oriented models. The are special drawing tools for making data flowcharts, data process diagrams, structured analysis diagrams, and information flow diagrams.Swim Lane Flowchart Symbols
Use the set of special professionally developed swim lane flowchart symbols - single, multiple, vertical and horizontal lanes from the Swimlanes and Swimlanes BPMN 1.2 libraries from the Business Process Diagram solution, the Swim Lanes library from the Business Process Mapping solution as the perfect basis for your Swim Lane Flowcharts of processes, algorithms and procedures.Cisco Network Topology. Cisco icons, shapes, stencils and symbols
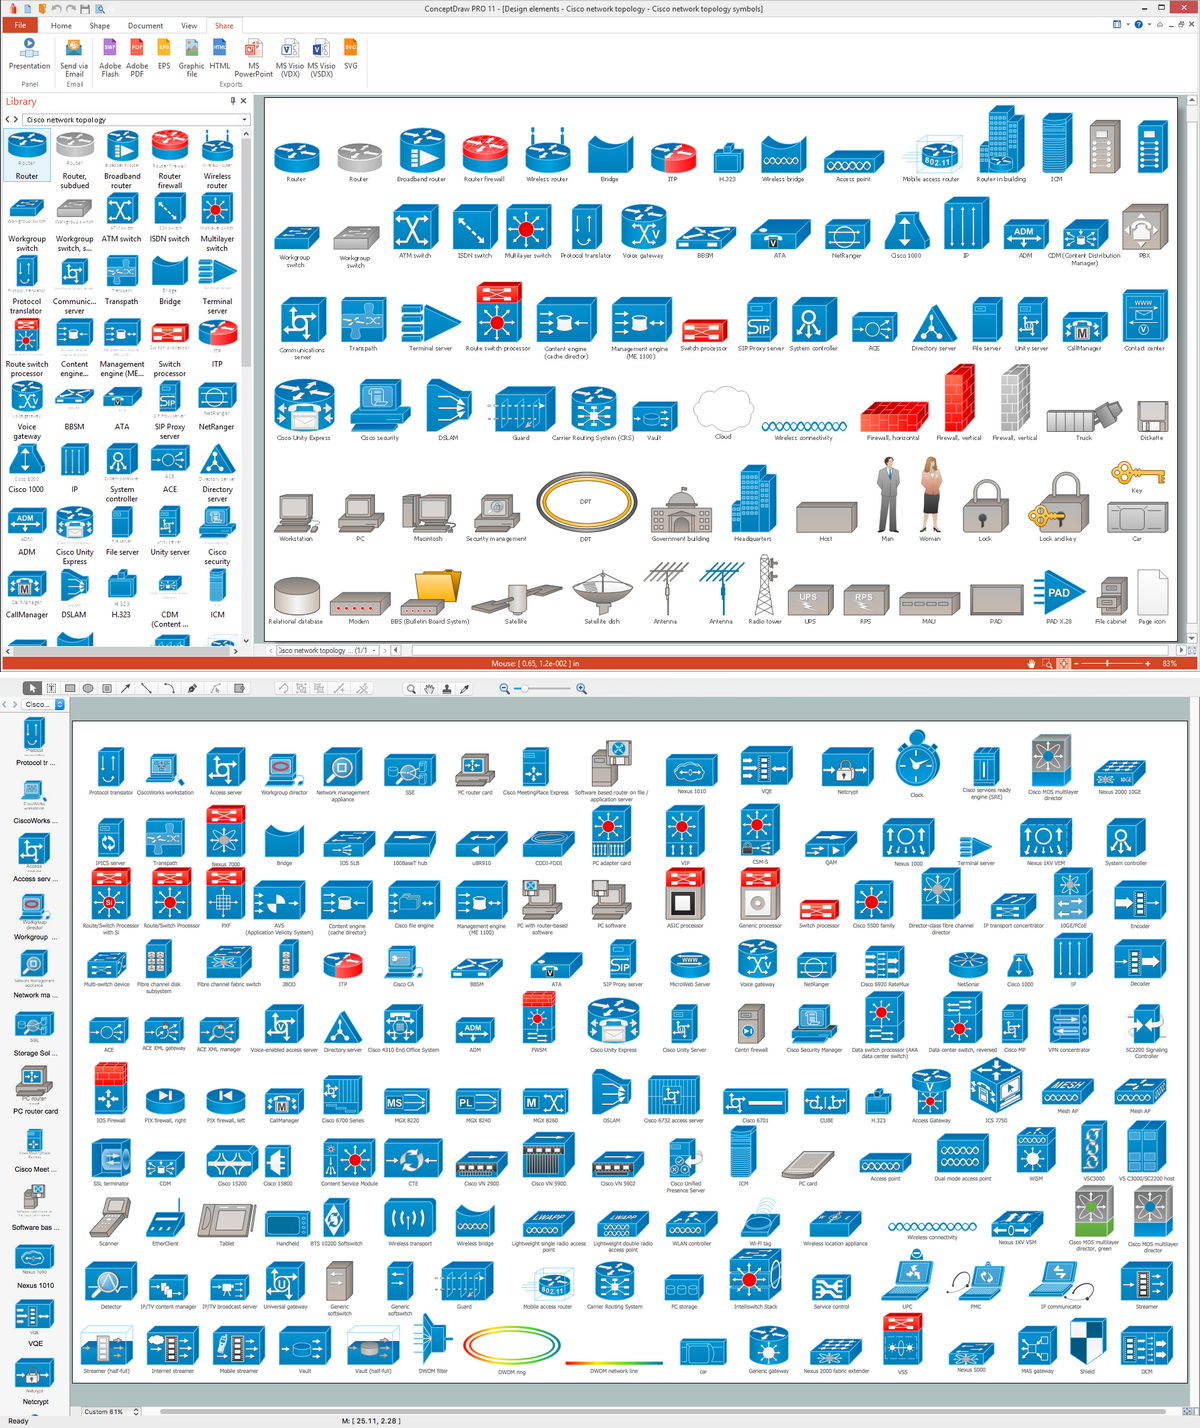
Cisco Network Topology represents the arrangement of worldwide recognized and standardized Cisco network symbols, icons, shapes, and stencils which help visualize the schemes of computer networks. Any equipment used in Cisco networks is also named a node and network topology diagram represents the scheme of connection the used nodes. Cisco Network Diagram illustrates how the signals enter on the networked devices and how the data spread within a network from one device to another. These diagrams are useful for engineers while constructing computer networks and working with them. Cisco Network Diagrams solution included to Computer and Networks area of ConceptDraw Solution Park contains quick-start templates, professionally designed samples and examples, and numerous libraries with a lot of predesigned vector design elements, icons, and shapes of Cisco equipment, components, devices, links which provide for ConceptDraw DIAGRAM users a perfect possibility of simple and quick drawing Cisco Network Diagrams and Schematics, Network Designs and Maps of any complexity.- Entity Relationship Diagram Symbols | ERD Symbols and Meanings ...
- How To Make Chen ER Diagram | Entity Relationship Diagram ...
- Electrical Symbols , Electrical Diagram Symbols | Entity Relationship ...
- Process Flow Diagram Symbols | Mechanical Drawing Symbols ...
- Entity Relationship Diagram Symbols | UML Class Diagram Notation ...
- UML Class Diagram Generalization Example UML Diagrams | Entity ...
- Entity Relationship Diagram Examples | | Database Flowchart ...
- Entity Relationship Diagram Symbols | Flow Diagram Software ...
- ERD Symbols and Meanings | Entity Relationship Diagram Symbols ...
- Mechanical Drawing Symbols | Process Flow Diagram Symbols ...
- Database Flowchart Symbols | ER diagram tool for OS X | ERD ...
- Entity Relationship Diagram Examples | Workflow Diagram ...
- ERD Symbols and Meanings | Design Element: Crows Foot for Entity ...
- Data Flow Diagram Symbols . DFD Library | ERD Symbols and ...
- Elements location of a welding symbol | Entity Relationship Diagram ...
- Flowchart design. Flowchart symbols , shapes, stencils and icons ...
- Er Diagram For Event Management System
- UML Class Diagram Notation | Entity Relationship Diagram Symbols ...
- Entity Relationship Diagram Symbols
- Database Design | Software and Database Design with ...


.png--diagram-flowchart-example.png)


