"The symbols and conventions used in welding documentation are specified in national and international standards such as ISO 2553 Welded, brazed and soldered joints -- Symbolic representation on drawings and ISO 4063 Welding and allied processes -- Nomenclature of processes and reference numbers. The US standard symbols are outlined by the American National Standards Institute and the American Welding Society and are noted as "ANSI/ AWS".
In engineering drawings, each weld is conventionally identified by an arrow which points to the joint to be welded. The arrow is annotated with letters, numbers and symbols which indicate the exact specification of the weld. In complex applications, such as those involving alloys other than mild steel, more information may be called for than can comfortably be indicated using the symbols alone. Annotations are used in these cases." [Symbols and conventions used in welding documentation. Wikipedia]
The example chart "Elements of welding symbol" is redesigned using the ConceptDraw PRO diagramming and vector drawing software from the Wikipedia file: Elements of a welding symbol.PNG.
[en.wikipedia.org/ wiki/ File:Elements_ of_ a_ welding_ symbol.PNG]
The diagram example "Elements location of a welding symbol" is contained in the Mechanical Engineering solution from the Engineering area of ConceptDraw Solution Park.
Welding joint symbol chart

Entity Relationship Diagram - ERD - Software for Design Crows Foot ER Diagrams
_Win_Mac.png)

Influence Diagram Software

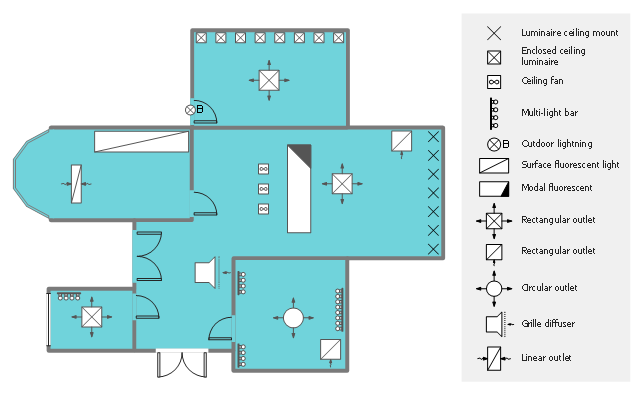
This reflected ceiling plan (RCP) sample shows lighting and HVAC layout.
"A "reflected ceiling plan" shows a view of the room as if looking from above, through the ceiling, at a mirror installed one foot below the ceiling level, which shows the reflected image of the ceiling above. This convention maintains the same orientation of the floor and ceilings plans - looking down from above. Reflected Ceiling Plans or RCP's are used by designers and architects to demonstrate lighting, visible mechanical features, and ceiling forms as part of the documents provided for construction." [Floor plan. Wikipedia]
The lighting and HVAC layout example "Reflected ceiling plan" was created using the ConceptDraw DIAGRAM diagramming and vector drawing software extended with the Reflected Ceiling Plans solution from the Building Plans area of ConceptDraw Solution Park.
Lighting and HVAC layout
Network Glossary Definition


- Fundamental Mechanical Drowing Symbols And Conventions
- Mechanical Convention
- Elements location of a welding symbol | Mechanical Engineering ...
- Mechanical Drawing Symbols | Mechanical Engineering ...
- Elements location of a welding symbol | Conventions Used For ...
- Fundamental Mechanical Drafting Symbols And Conventions
- Mechanical Drawing Symbols | Elements location of a welding ...
- Mechanical Drawing Symbols | Mechanical Engineering | CAD ...
- Mechanical Drawing Symbols | Mechanical Drawing Software ...
- Mechanical Symbols Chart
- Basic Flowchart Symbols and Meaning | Seating Plans | Sign ...
- Welding symbols | Elements location of a welding symbol ...
- Mechanical Drawing Symbols | How to Create a Mechanical ...
- Mechanical Drawing Symbols | CAD Drawing Software for Making ...
- Mechanical Drawing Symbols | Elements location of a welding ...
- Mechanical Drawing Symbols | Welding symbols | Elements location ...
- Mechanical Drawing Symbols | Mechanical Engineering | Elements ...
- Mechanical Engineering | Mechanical Drawing Symbols ...
- Mechanical Engineering | Elements location of a welding symbol ...
- Mechanical Drawing Symbols | Elements location of a welding ...