This site uses cookies. By continuing to browse the ConceptDraw site you are agreeing to our Use of Site Cookies.

Database Design

ConceptDraw DIAGRAM extended with IDEF Business Process Diagrams solution from the Business Processes area of ConceptDraw Solution Park is an ideal software for effective database design and drawing IDEF diagrams visually representing all steps of database design process.

Software and Database Design with ConceptDraw DIAGRAM

ConceptDraw DIAGRAM is a perfect tool for designing and planning tasks such as:
UML diagramming; designing and prototyping Graphical User Interface (GUI); flowcharts, data flow diagrams; database and ERD diagramming (Chen ERD, Database Model diagram, Express-G, Martin ERD, ORM Diagrams and more); SSADM diagrams, Booch diagrams, Nassi-Shneiderman diagrams with special flowchart symbols.

Entity Relationship Diagram Symbols

Creating an entity-relationship (ER) model is to visually represent the structure of a business database, where data equates to entities (or objects) that are linked by defined relationships expressing dependencies and requirements. By nature it is an abstract visualization, the first step in the design process towards creating a logical and functional database.
ERD symbols used for professional ERD drawing are collected in libraries from the Entity-Relationship Diagram (ERD) solution for ConceptDraw DIAGRAM.

Database Flowchart Symbols

Data base diagrams describes inter-related data and tables. It describes roles and relationships, internal and external dependencies, data exchange conventions and structures of knowledge domain.
ConceptDraw Software provides number of data-base chart libraries including major 49 vector symbols. Use these DFD flowchart symbol libraries to design data-base structure and models, use it to design data base process-oriented models, or simple data-oriented models. The are special drawing tools for making data flowcharts, data process diagrams, structured analysis diagrams, and information flow diagrams.

Data Flow Diagram Symbols. DFD Library

Data Flow Diagrams show information transfers and process steps of a system. The general concept is an approach of a depicting how occurs input in a system, further processes and what runs out. The aim of DFD is in accomplishing of understanding between developers and users. Data flow diagrams are maintained with other methods of structured systems analysis.

Software development with ConceptDraw DIAGRAM

ConceptDraw possesses powerful tools for designing of technical documentation for object-oriented projects. The libraries included in the package allow to easily draw class hierarchies, object hierarchies and diagrams of data flows with the use of the most popular notations, including UML and Booch notations.

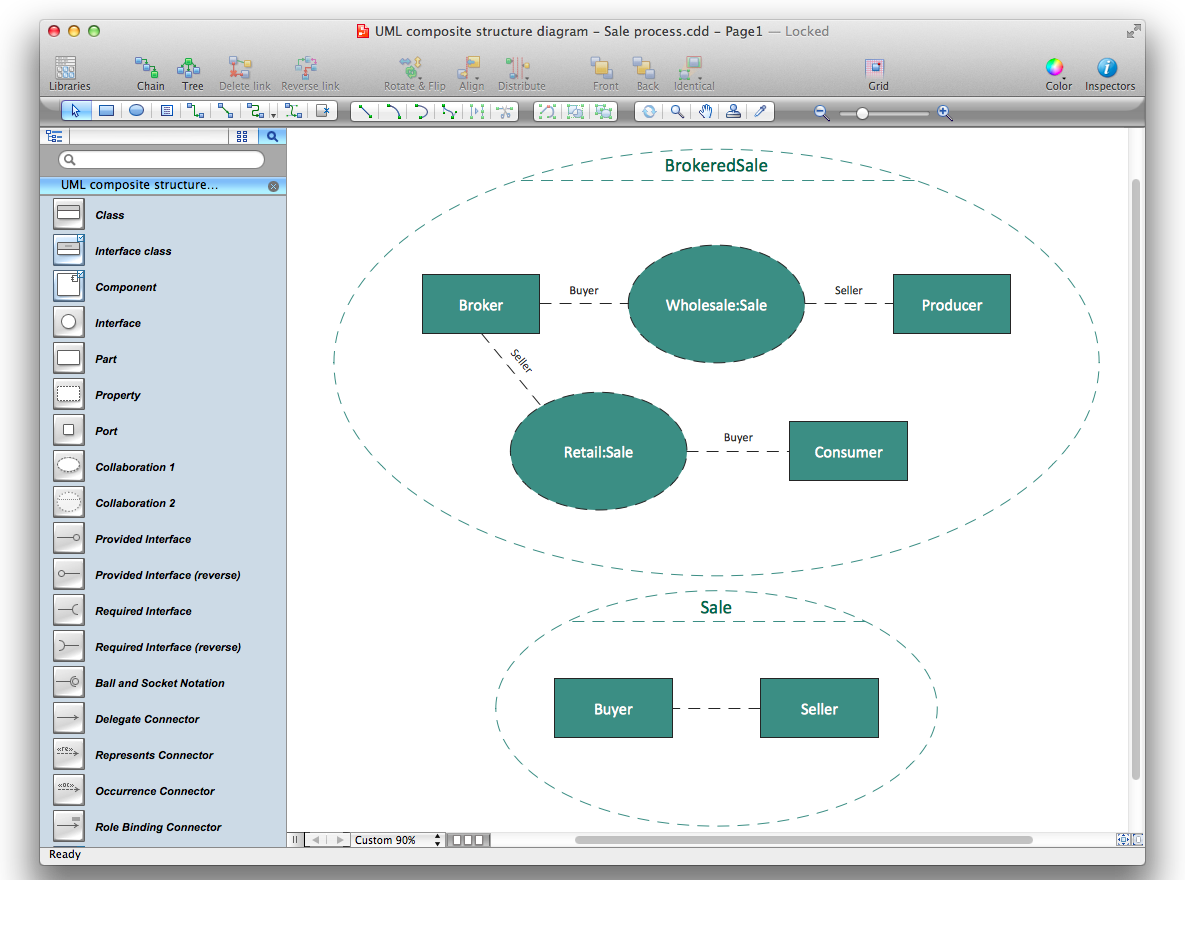
Diagramming Software for UML Composite Structure Diagrams

UML Composite Structure Diagram shows the internal structure of a class and the possible interactions at this structure.

Diagramming Software for Design UML Activity Diagrams

Activity diagram describes the business and operational step-by-step workflows of components in a system. An activity diagram shows the overall flow of control.

entity-relationship diagram, ER-diagram, database ERD Entity-Relationship Diagram (ERD)

entity-relationship diagram, ER-diagram, database ERD
An Entity-Relationship Diagram (ERD) is a visual presentation of entities and relationships. That type of diagrams is often used in the semi-structured or unstructured data in databases and information systems. At first glance ERD is similar to a flowch

Diagramming Software for Design UML Use Case Diagrams

Use Case Diagrams describes the functionality provided by a system in terms of actors, their goals represented as use cases, and any dependencies among those use cases.