"Process Decision Program Chart (PDPC).
A useful way of planning is to break down tasks into a hierarchy, using a tree diagram. The PDPC extends the tree diagram a couple of levels to identify risks and countermeasures for the bottom level tasks. Different shaped boxes are used to highlight risks and identify possible countermeasures (often shown as 'clouds' to indicate their uncertain nature). The PDPC is similar to the Failure Modes and Effects Analysis (FMEA) in that both identify risks, consequences of failure, and contingency actions; the FMEA also rates relative risk levels for each potential failure point." [Seven Management and Planning Tools. Wikipedia]
The Risk diagram (process decision program chart, PDPC) determines the risks when corrective action is not performed correctly. Also, it helps develop descriptions for preventive actions at the level of execution.
The Risk diagram (PDPC) template for the ConceptDraw PRO diagramming and vector drawing software is included in the solution "Seven Management and Planning Tools" from the Management area of ConceptDraw Solution Park.
www.conceptdraw.com/ solution-park/ management-seven-mp-tools
Risk diagram
-template.png--diagram-flowchart-example.png)
 Seven Management and Planning Tools
Seven Management and Planning Tools solution extends ConceptDraw PRO and ConceptDraw MINDMAP with features, templates, samples and libraries of vector stencils for drawing management mind maps and diagrams.
CORRECTIVE ACTIONS PLANNING Risk Diagram (PDPC)
 - Health care - Business Diagram")

 - Minimization-of-material-wastage - Business Diagram")
The Action Plan

Decision Making

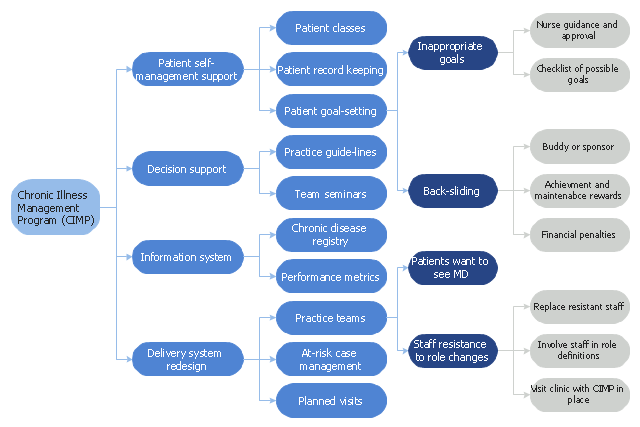
"Chronic care management encompasses the oversight and education activities conducted by health care professionals to help patients with chronic diseases and health conditions such as diabetes, high blood pressure, lupus, multiple sclerosis and sleep apnea learn to understand their condition and live successfully with it. This term is equivalent to disease management (health) for chronic conditions. The work involves motivating patients to persist in necessary therapies and interventions and helping them to achieve an ongoing, reasonable quality of life." [Chronic care management. Wikipedia]
The health care risk diagram (process decision program chart, PDPC) example "Chronic care improvement" was created using the ConceptDraw PRO diagramming and vector drawing software extended with the solution "Seven Management and Planning Tools" from the Management area of ConceptDraw Solution Park.
www.conceptdraw.com/ solution-park/ management-seven-mp-tools
Risk diagram
Risk Analysis

Activity Network (PERT) Chart

PROBLEM ANALYSIS Relations Diagram

Relationships Analysis

Cause & Effect Analysis

Affinity Diagram Software

Seven Management and Planning Tools solution from the Business Productivity area of ConceptDraw Solution Park provides templates, samples and ready-to-use vector stencils that will help you design the professional looking Affinity Diagrams in a few moments.
Activity Network Diagram Method

This sample shows the PERT (Program Evaluation Review Technique) chart of the request on proposal. A request for proposal (RFP) is a request of the company or the organization to potential suppliers to submit the business proposals for service or goods that it is interested to purchase. The RFP is represented on the initial procurement stage and allows to define the risks and benefits.
PROBLEM ANALYSIS Identify and Structure Factors

Problem Analysis

CORRECTIVE ACTIONS PLANNING Involvement Matrix

CORRECTIVE ACTIONS PLANNING PERT Chart

- Process decision program chart ( PDPC ) - Personal activity | Risk ...
- CORRECTIVE ACTIONS PLANNING Risk Diagram ( PDPC ) | Risk ...
- Preventive Action | Risk diagram ( PDPC ) template | Process ...
- Risk diagram ( PDPC ) template | CORRECTIVE ACTIONS ...
- Risk diagram ( PDPC ) template | CORRECTIVE ACTIONS ...
- process decision program chart, pdpc , diagram
- CORRECTIVE ACTIONS PLANNING Risk Diagram ( PDPC )
- Process decision program chart ( PDPC ) - Personal activity | Risk ...
- Risk Analysis | CORRECTIVE ACTIONS PLANNING Risk Diagram ...
- CORRECTIVE ACTIONS PLANNING Risk Diagram ( PDPC ...
- CORRECTIVE ACTIONS PLANNING Risk Diagram ( PDPC ) | Cross ...
- Risk diagram ( PDPC ) template - Conceptdraw.com
- CORRECTIVE ACTIONS PLANNING Risk Diagram ( PDPC ) | Social ...
- CORRECTIVE ACTIONS PLANNING Risk Diagram ( PDPC ) | Risk ...
- CORRECTIVE ACTIONS PLANNING PERT Chart | CORRECTIVE ...
- CORRECTIVE ACTIONS PLANNING Risk Diagram ( PDPC ) | How ...
- Preventive Action | CORRECTIVE ACTIONS PLANNING Risk ...
- Decision Making | Cross-Functional Flowchart | CORRECTIVE ...
- CORRECTIVE ACTIONS PLANNING Risk Diagram ( PDPC ) | Seven ...
- CORRECTIVE ACTIONS PLANNING Risk Diagram ( PDPC ) | Seven ...