Basic Flowchart Symbols and Meaning


UML Class Diagram Example for GoodsTransportation System

 Computer and Networks Area
The solutions from Computer and Networks Area of ConceptDraw Solution Park collect samples, templates and vector stencils libraries for drawing computer and network diagrams, schemes and technical drawings.
UML Class Diagram Generalization Example UML Diagrams

Transportation Infographics

Flow chart Example. Warehouse Flowchart


Design Pictorial Infographics. Design Infographics

Timing diagram


 Entity-Relationship Diagram (ERD)
Entity-Relationship Diagram (ERD) solution extends ConceptDraw PRO software with templates, samples and libraries of vector stencils from drawing the ER-diagrams by Chen's and crow’s foot notations.
UML Use Case Diagram Example Registration System

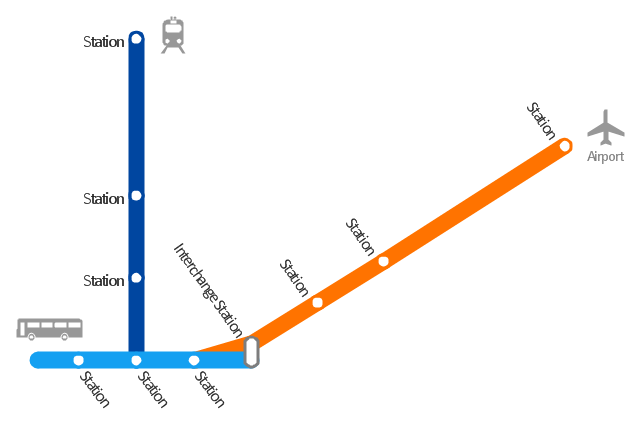
"A transit map is a topological map in the form of a schematic diagram used to illustrate the routes and stations within a public transport system - whether this be bus lines, tramways, rapid transit, commuter rail or ferry routes. The main components are color coded lines to indicate each line or service, with named icons to indicate stations or stops. ...
There are a growing number of books, websites and works of art on the subject of urban rail and metro map design and use. There are now hundreds of examples of diagrams in an urban rail or metro map style that are used to represent everything from other transit networks like buses and national rail services to sewerage systems and Derbyshire public houses." [Transit map. Wikipedia]
The transportation map template for the ConceptDraw PRO diagramming and vector drawing software is included in the Spatial Infographics solution from the area "What is Infographics" of ConceptDraw Solution Park.
Transit map
 Entity-Relationship Diagram (ERD)
An Entity-Relationship Diagram (ERD) is a visual presentation of entities and relationships. That type of diagrams is often used in the semi-structured or unstructured data in databases and information systems. At first glance ERD is similar to a flowch
How to draw Metro Map style infographics? (New York)

This TQM diagram example was redesigned from the illustration of the Highway Performance Monitoring System (HPMS) Field Manual from the website of the Federal Highway Administration (FHWA).
[fhwa.dot.gov/ policyinformation/ hpms/ fieldmanual/ chapter7.cfm]
"Highway Performance Monitoring System (HPMS).
The HPMS is a national level highway information system that includes data on the extent, condition, performance, use and operating characteristics of the nation's highways. The HPMS contains administrative and extent of system information on all public roads, while information on other characteristics is represented in HPMS as a mix of universe and sample data for arterial and collector functional systems. Limited information on travel and paved miles is included in summary form for the lowest functional systems.
HPMS was developed in 1978 as a continuing database, replacing the special biennial condition studies that had been conducted since 1965. The HPMS has been modified several times since its inception. Changes have been made to reflect changes in the highway systems, legislation, and national priorities, to reflect new technology, and to consolidate or streamline reporting requirements." [fhwa.dot.gov/ policyinformation/ hpms.cfm]
The TQM flowchart example "Software workflow diagram" was created using the ConceptDraw PRO diagramming and vector drawing software extended with the Total Quality Management (TQM) Diagrams solution from the Quality area of ConceptDraw Solution Park.
TQM diagram

 Divided Bar Diagrams
The Divided Bar Diagrams Solution extends the capabilities of ConceptDraw PRO v10 with templates, samples, and a library of vector stencils for drawing high impact and professional Divided Bar Diagrams and Graphs, Bar Diagram Math, and Stacked Graph.
- Diagrams Showing Forms Of Transport
- Diagram To Show Various Forms Of Transportation
- Draw A Diagram Of Various Means Of Transportation
- Give The Diagrammatic Explanation Of Any Form Of Transportation
- UML Class Diagram Example for Transport System
- Simple Diagram Of Means Of Transportation
- Diagram Of Means Of Transport
- How To Draw Flow Diagram Showing Means Of Transportation
- With The Aid Of A Diagram Draw Forms Of Transportation
- Rail transport - Vector stencils library | Road Transport - Design ...
- Draw Pictures Showing Different Means Of Transport
- Road Transport - Design Elements | Watercraft - Design Elements ...
- UML Use Case Diagram Example Registration System
- Diagrams That Illustrate The Means Of Transportation
- Road Transport - Design Elements | Rail transport - Design ...
- Draw A Diagram Of A Transportation
- How To Draw Different Means Of Transport
- Circuit Diagram For Bus Transportation System
- Intelligent transportation system | Visible light communication | Road ...
- Diagram On Transportation Chart