Area Chart

 Basic Area Charts
This solution extends the capabilities of ConceptDraw PRO v10.3.0 (or later) with templates, samples and a library of vector stencils for drawing Area Charts (area graphs) that visualize changes in values by filling in the area beneath the line connecting data points.
 Area Charts
Area Charts are used to display the cumulative totals over time using numbers or percentages; or to show trends over time among related attributes. The Area Chart is effective when comparing two or more quantities. Each series of data is typically represented with a different color, the use of color transparency in an object’s transparency shows overlapped areas and smaller areas hidden behind larger areas.
Basic Diagramming


Line Chart Examples

Pyramid Diagram

This area chart sample shows the US federal prisoner population changes from 1914 to 2010.
"The Federal Bureau of Prisons (BOP) is a United States federal law enforcement agency. A subdivision of the U.S. Department of Justice, the Bureau is responsible for the administration of the federal prison system. The system also handles prisoners who committed acts considered felonies under the District of Columbia's law. The Bureau was established in 1930 to provide more progressive and humane care for federal inmates, to professionalize the prison service, and to ensure consistent and centralized administration of the 11 federal prisons in operation at the time.
According to its official web site, the Bureau consists of more than 116 institutions, six regional offices, its headquarters office in Washington, D.C., two staff training centers, and 22 community corrections offices, and is responsible for the custody and care of approximately 210,000 federal offenders. Approximately 82 percent of these inmates are confined in Bureau-operated correctional facilities or detention centers. The remainder are confined through agreements with state and local governments or through contracts with privately operated community corrections centers, detention centers, prisons, and juvenile facilities." [Federal Bureau of Prisons. Wikipedia]
This area graph sample was redesigned from the Wikimedia Commons file: Federal timeline US prisoners.gif. [commons.wikimedia.org/ wiki/ File:Federal_ timeline_ US_ prisoners.gif]
The area chart example "Federal timeline US prisoners" was created using the ConceptDraw PRO diagramming and vector drawing software extended with the Area Charts solution from the Graphs and Charts area of ConceptDraw Solution Park.
Area graph

What Is a Line Chart

Line Graph

Pictures of Graphs

Picture Graph

Chart Examples

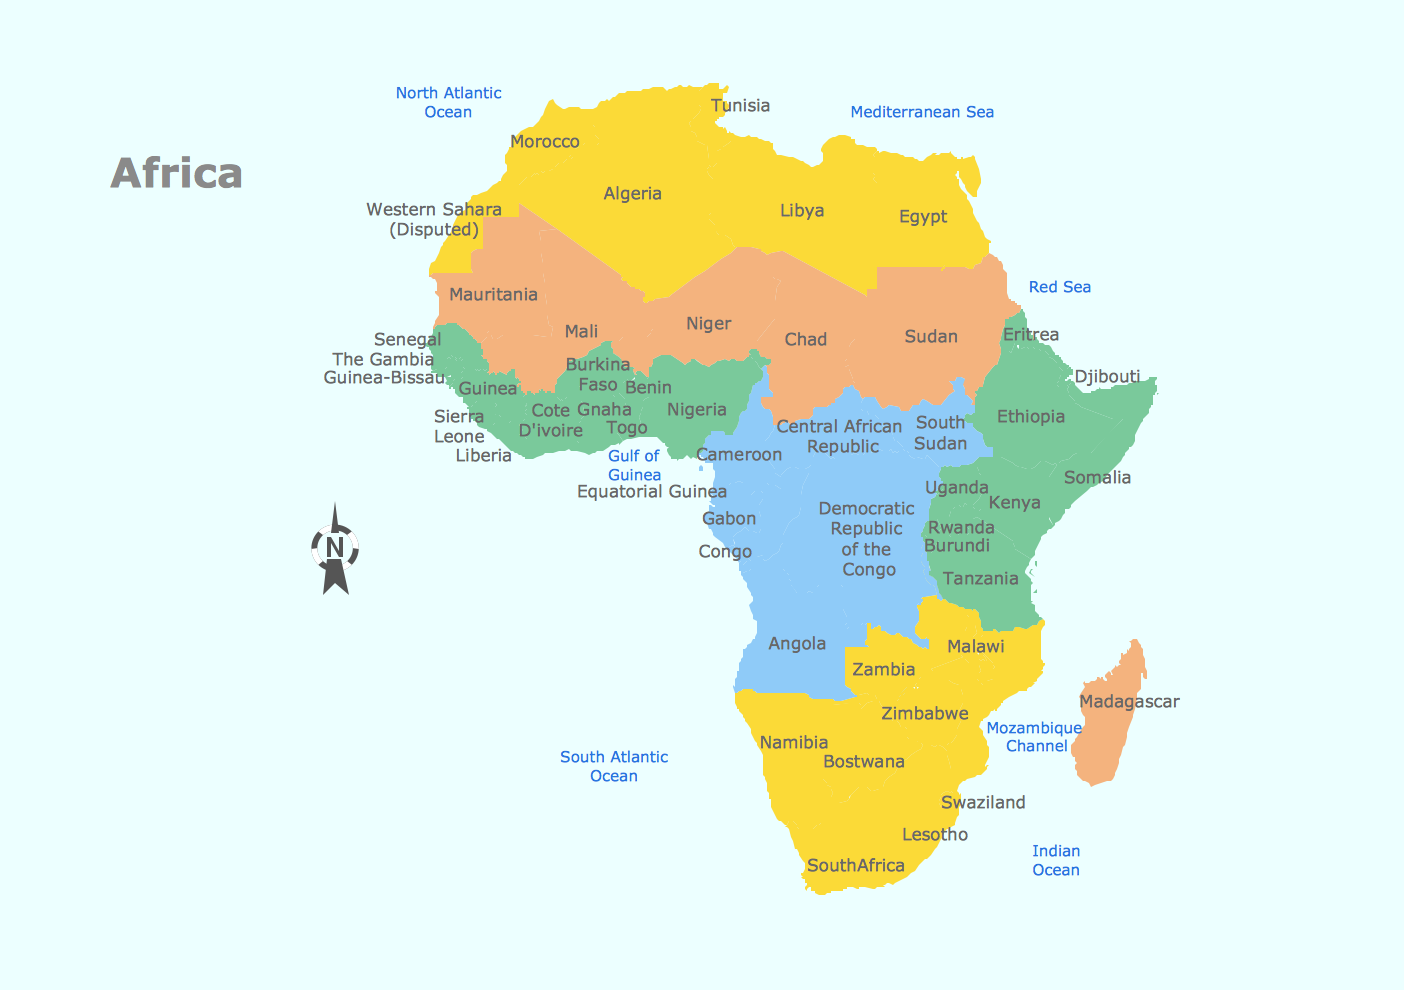
Geo Map - Africa
Pie Chart Software

Visual Presentations Made Easy with Diagramming Software

- Basic Diagramming | Line Chart Examples | Area Chart | An Easy ...
- Basic Diagramming | Area Chart | Scatter Graph Charting Software ...
- Basic Diagramming | Line Chart Examples | Area Charts ...
- Area Charts | Circle-Spoke Diagrams | Picture Graphs | Population ...
- Line Chart Examples | San Francisco CA Population Growth ...
- USA Maps | Circle-Spoke Diagrams | Area Charts | Diagram ...
- Basic Diagramming | Map of Germany — Saarland State | Area ...
- Example Of Chart Diagram Of Showing World Population
- San Francisco population history - Area chart | San Francisco ...
- Area Charts
- San Francisco population history - Area chart | Geo Map - USA ...
- Sample Chart Of Population
- Diagram On Population Data Using A Graph
- Area charts - Vector stencils library | How to Draw an Area Chart in ...
- Line Chart Examples | Pictures of Graphs | Types of Flowchart ...
- Area Charts | Picture Graphs | Line Graphs | Chart In Word On ...
- Storage area networks (SAN). Computer and Network Examples ...
- Basic Diagramming | Picture Graphs | Area Charts | Videos Bar ...
- Area Charts | San Francisco County Population Line Graph
- Pictorial Diagram With Population