Venn Diagrams

HelpDesk
How to Make a Garden Design

Venn Diagram Maker

SWOT Analysis

Workflow Diagram

PDPC

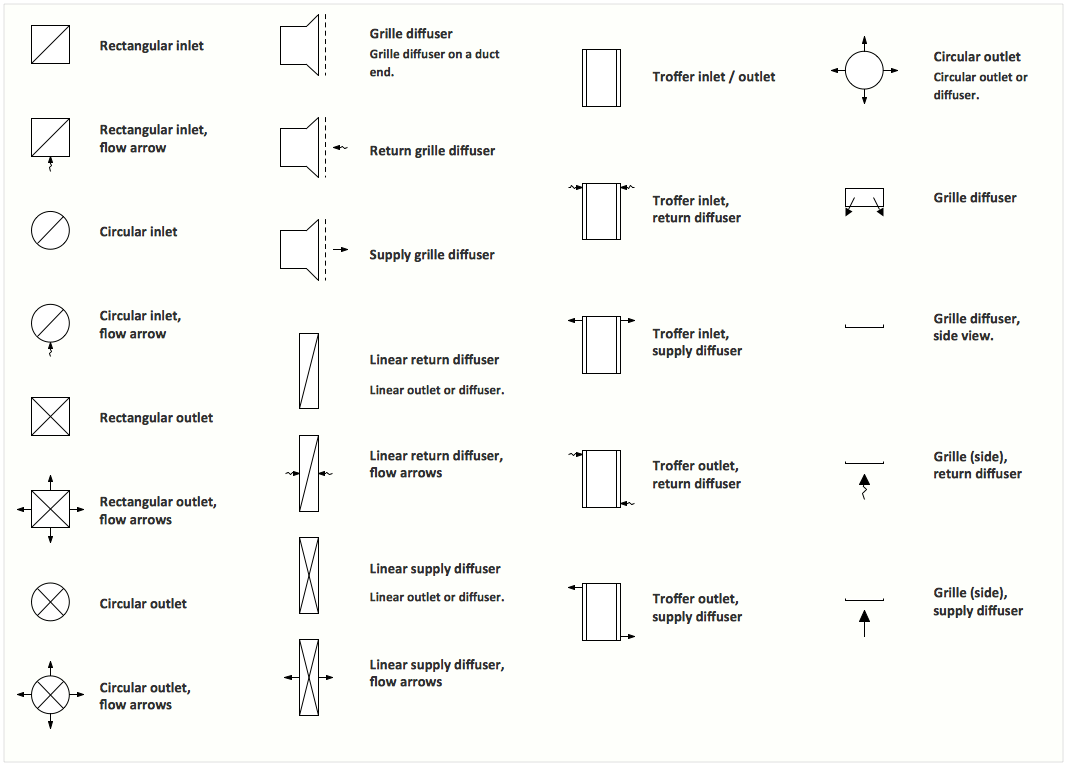
Interior Design. Registers, Drills and Diffusers — Design Elements
Data structure diagram with ConceptDraw DIAGRAM

Relative Circular Diagram
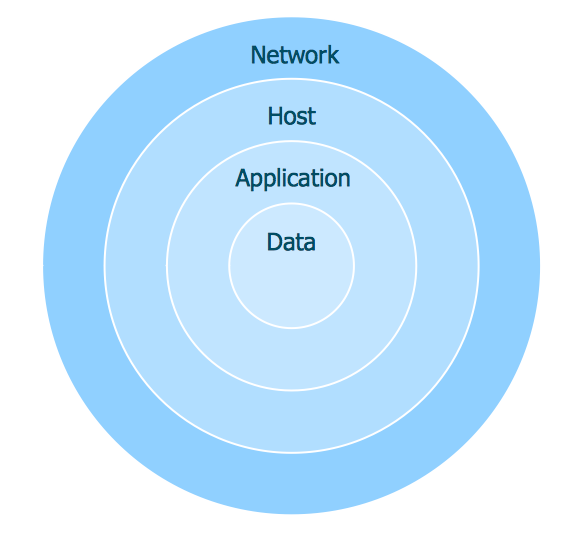
 Target and Circular Diagrams
This solution extends ConceptDraw DIAGRAM software with samples, templates and library of design elements for drawing the Target and Circular Diagrams.
What is SWOT Analysis?

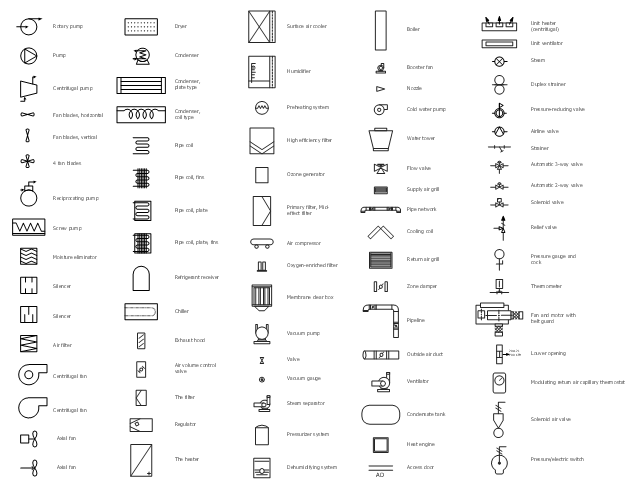
The vector stencil library "HVAC equipment" contains 84 HVAC equipment symbols as pumps, fans, condensers, pipe coils, silencers, etc.
Use it for drawing HVAC system diagrams, heating, ventilation, air conditioning, refrigeration, automated building control, and environmental control design floor
plans and equipment layouts.
"HVAC (heating, ventilation, and air conditioning) is the technology of indoor and vehicular environmental comfort. HVAC system design is a subdiscipline of mechanical engineering, based on the principles of thermodynamics, fluid mechanics, and heat transfer. Refrigeration is sometimes added to the field's abbreviation as HVAC&R or HVACR, or ventilating is dropped as in HACR (such as the designation of HACR-rated circuit breakers).
HVAC is important in the design of medium to large industrial and office buildings such as skyscrapers and in marine environments such as aquariums, where safe and healthy building conditions are regulated with respect to temperature and humidity, using fresh air from outdoors." [HVAC. Wikipedia]
The vector stencils example "Design elements - HVAC equipment" is included in HVAC Plans solution from the Building Plans area of ConceptDraw Solution Park.
HVAC equipment symbols
 Venn Diagrams
Venn Diagrams are actively used to illustrate simple set relationships in set theory and probability theory, logic and statistics, mathematics and computer science, linguistics, sociology, and marketing. Venn Diagrams are also often used to visually summarize the status and future viability of a project.
- Diagram Of Business Environment That Shows All The Elements
- Draw The Diagram Of Business Environment
- UML Deployment Diagram . Design Elements | Process Flowchart ...
- UML Deployment Diagram . Design Elements | Network Diagram ...
- UML Deployment Diagram . Design Elements | Block diagram ...
- Environment Diagrams
- UML Deployment Diagram . Design Elements | UML Deployment ...
- Venn Diagram Examples for Problem Solving. Environmental Social ...
- Process Flowchart | UML Deployment Diagram . Design Elements ...
- Map Or Drawing And Diagram Of Environment
- Process Flowchart | UML Deployment Diagram . Design Elements ...
- Target and Circular Diagrams | Target diagrams - Vector stencils ...
- Diagram Heating Ventilation Air Conditioner
- Venn Diagram Examples for Problem Solving. Environmental Social ...
- UML Deployment Diagram . Design Elements | Components of ER ...
- Process Flowchart | Venn Diagram Examples for Problem Solving ...
- Venn Diagram Examples for Problem Solving. Environmental Social ...
- Design elements - Walls, shell and structure | Venn Diagram ...
- UML Deployment Diagram . Design Elements | Jet fuel mercaptan ...
- 4 Level pyramid model diagram - Information systems types | 5 Level ...