How to Build Cloud Computing Diagram Principal Cloud Manufacturing

Block Diagram

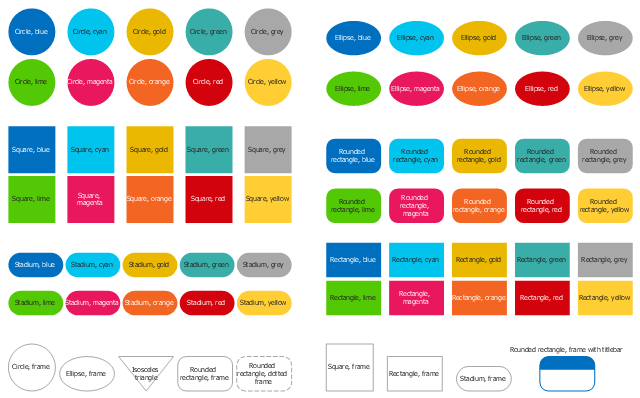
The vector stencils library "Cloud shapes" contains 69 geometric shapes.
Use it to design your cloud computing diagrams and infographics with ConceptDraw PRO software.
"The essence of a diagram can be seen as: ...
- with building blocks such as geometrical shapes connected by lines, arrows, or other visual links." [Diagram. Wikipedia]
The geometric shapes example "Design elements - Cloud shapes" is included in the Cloud Computing Diagrams solution from the Computer and Networks area from ConceptDraw Solution Park.
Geometric shapes for cloud computing diagrams
Pyramid Diagram

Cloud Computing Architecture Diagrams

 Event-driven Process Chain Diagrams
Event-driven Process Chain (EPC) Diagram is a type of flowchart widely used for modeling in business engineering and reengineering, business process improvement, and analysis. EPC method was developed within the Architecture of Integrated Information Systems (ARIS) framework.
 Pyramid Diagrams
Pyramid Diagrams solution extends ConceptDraw PRO software with templates, samples and library of vector stencils for drawing the marketing pyramid diagrams.
HelpDesk
How to Add a Block Diagram to a MS Word ™ Document Using ConceptDraw PRO

HelpDesk
How to Add a Block Diagram to a PowerPoint Presentation Using ConceptDraw PRO

 Interactive Voice Response Diagrams
Interactive Voice Response Diagrams solution extends ConceptDraw PRO v10 with samples, templates and library of ready-to-use vector stencils to help create Interactive Voice Response (IVR) diagrams illustrating a work of interactive voice response system, Voice-over-Internet Protocol (VoIP) diagrams and Action VoIP diagrams with representing voice actors on them.
 Block Diagrams
Block diagrams solution extends ConceptDraw PRO software with templates, samples and libraries of vector stencils for drawing the block diagrams.
 Cross-Functional Flowcharts
Cross-functional flowcharts are powerful and useful tool for visualizing and analyzing complex business processes which requires involvement of multiple people, teams or even departments. They let clearly represent a sequence of the process steps, the order of operations, relationships between processes and responsible functional units (such as departments or positions).
HelpDesk
How to Draw a Block Diagram in ConceptDraw PRO

 Flowcharts
The Flowcharts Solution for ConceptDraw PRO v10 is a comprehensive set of examples and samples in several different color themes for professionals that need to graphically represent a process. Solution value is added by basic flow chart template and shapes' library of Flowchart notation. ConceptDraw PRO flow chart creator lets one depict a processes of any complexity and length, as well design of the flowchart either vertically or horizontally.
HelpDesk
How To Create a MS Visio Block Diagram Using ConceptDraw PRO

- Building Blocks Of Marketing Cloud
- Sequence Diagram for Cloud Computing | UML Sequence Diagram ...
- UML Block Diagram | The Building Blocks Used in EPC Diagrams ...
- Collaboration Diagram And Its Building Blocks
- Functional Flow Block Diagram | Block Diagrams | UML Use Case ...
- UML Sequence Diagram | Diagramming Software for designing ...
- Geometrical Diagram
- Design elements - Cloud shapes | Mathematics Symbols | How to ...
- Solving quadratic equation algorithm - Flowchart | The Building ...
- Sequence Diagram Tool | UML Sequence Diagram . Design ...
- Marketing - Vector stencils library | How to Build Cloud Computing ...
- Block Diagram | Cloud clipart - Vector stencils library | Lego Visio ...
- UML Sequence Diagram . Design Elements | Data Flow Diagram ...
- UML Sequence Diagram | Diagramming Software for designing ...
- Sequence Diagram for Cloud Computing | UML Diagram | Design ...
- UML Block Diagram | Cisco Buildings. Cisco icons, shapes, stencils ...
- Marketing Diagrams | Process Flowchart | Flowchart Marketing ...
- Block Diagram Of Wifi
- Diagram Of Different Geomatrical Shape
- Illustrate The Building Blocks Of An Mis With Aid Of A Diagram