 Marketing Diagrams
This solution extends ConceptDraw PRO with samples, templates and library of design elements for drawing the marketing diagrams.
This cloud computing diagram example was drawn on the base of Wikimedia Commons file: CloudMarketingDiagram.png. [commons.wikimedia.org/ wiki/ File:CloudMarketingDiagram.png]
This file is licensed under the Creative Commons Attribution 3.0 Unported license. [creativecommons.org/ licenses/ by/ 3.0/ deed.en]
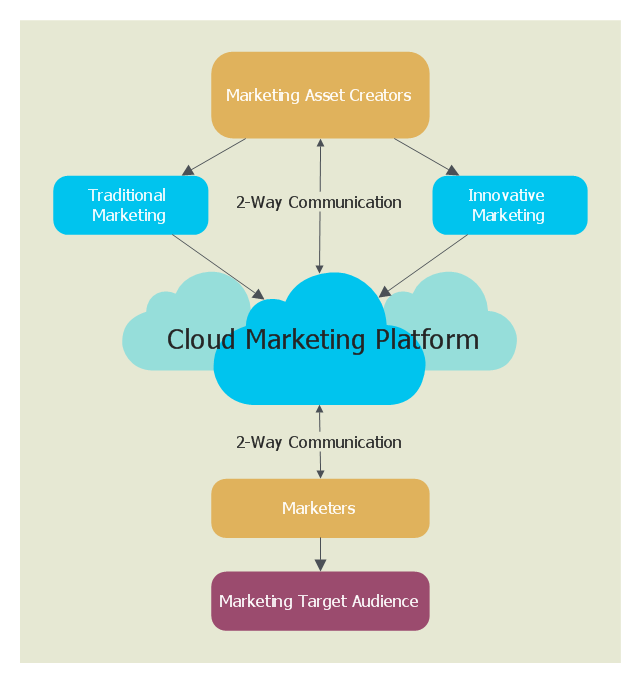
"Cloud marketing is the process of an organisations efforts to market their goods and services online through integrated digital experiences, by which they are specialised for every single end user. The aim is to use advertising methods to target customers via online applications through social media websites such as Facebook, Twitter and various online portals to target consumers. Cloud marketing platforms are supported with third parties which maintain the platform." [Cloud marketing. Wikipedia]
The example "Cloud marketing diagram" was drawn using ConceptDraw PRO software extended with the Cloud Computing Diagrams solution from the Computer and Networks area of ConceptDraw Solution Park.
This file is licensed under the Creative Commons Attribution 3.0 Unported license. [creativecommons.org/ licenses/ by/ 3.0/ deed.en]
"Cloud marketing is the process of an organisations efforts to market their goods and services online through integrated digital experiences, by which they are specialised for every single end user. The aim is to use advertising methods to target customers via online applications through social media websites such as Facebook, Twitter and various online portals to target consumers. Cloud marketing platforms are supported with third parties which maintain the platform." [Cloud marketing. Wikipedia]
The example "Cloud marketing diagram" was drawn using ConceptDraw PRO software extended with the Cloud Computing Diagrams solution from the Computer and Networks area of ConceptDraw Solution Park.
Cloud computing diagram example
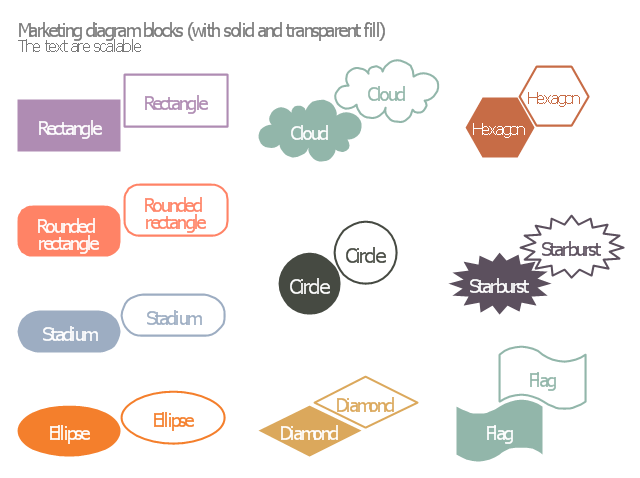
The vector stencils library "Marketing diagram" contains 20 solid and transparent geometric shapes: rectangle, rounded rectangle, ellipse, cloud, circle, diamond, hexagon, starburst, flag.
Use it to illustrate your marketing infograms with block diagrams.
"The term diagram in its commonly used sense can have a general or specific meaning:
(1) visual information device: Like the term "illustration" the diagram is used as a collective term standing for the whole class of technical genres, including graphs, technical drawings and tables.
(2) specific kind of visual display: This is the genre that shows qualitative data with shapes that are connected by lines, arrows, or other visual links. ...
In the specific sense diagrams and charts contrast with computer graphics, technical illustrations, infographics, maps, and technical drawings, by showing "abstract rather than literal representations of information". The essence of a diagram can be seen as:
(1) a form of visual formatting devices;
(2) a display that does not show quantitative data (numerical data), but rather relationships and abstract information;
(3) with building blocks such as geometrical shapes connected by lines, arrows, or other visual links." [Diagram. Wikipedia]
The shapes example "Design elements - Marketing diagram" was created using the ConceptDraw PRO diagramming and vector drawing software extended with the Marketing Infographics solition from the area "Business Infographics" in ConceptDraw Solution Park.
Diagram building blocks
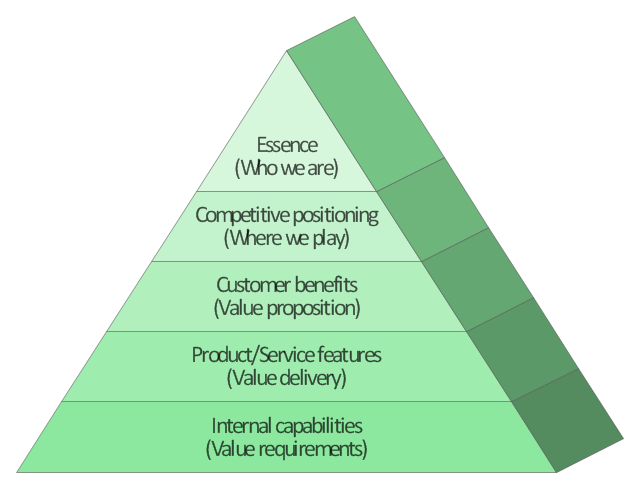
This market value pyramid diagram has 5 levels:
1) Essence (Who we are),
2) Competitive positioning (Where we play),
3) Customer benefits (Value proposition),
4) Product / Service features (Value delivery),
5) Internal capabilitiea (Value requirements).
Use this triangular scheme to develop your marketing strategy.
"Market value or OMV (Open Market Valuation) is the price at which an asset would trade in a competitive auction setting. Market value is often used interchangeably with open market value, fair value or fair market value, although these terms have distinct definitions in different standards, and may differ in some circumstances." [Market value. Wikipedia]
The triangle chart example "Market value" was created using the ConceptDraw PRO diagramming and vector drawing software extended with the Pyramid Diagrams solution from the Marketing area of ConceptDraw Solution Park.
Pyramid diagram
The vector stencils library "Target diagrams" contains 13 templates of target diagrams: marketing mix diagram, principles of marketing diagram, circle diagram, macro-micro environment diagram, stakeholder diagram, target market scope diagram.
Use these shapes to illustrate your marketing and sales documents, presentations, webpages and infographics in the ConceptDraw PRO diagramming and vector drawing software extended with the Target and Circular Diagrams solution from the Marketing area of ConceptDraw Solution Park.
www.conceptdraw.com/ solution-park/ marketing-target-and-circular-diagrams
Principles of marketing by Ph. Kotler

Marketing mix

Target

Principles of marketing by Ph. Kotler (prompt)
-target-diagrams---vector-stencils-library.png--diagram-flowchart-example.png)
Circle diagram

Macro-micro environmental forces diagram

Macro-micro environmental forces diagram (prompt)
-target-diagrams---vector-stencils-library.png--diagram-flowchart-example.png)
Stakeholder diagram

Target market scope diagram

Target diagram 1

Target diagram 2

Target diagram 3

Target diagram

 Entity-Relationship Diagram (ERD)
Entity-Relationship Diagram (ERD) solution extends ConceptDraw PRO software with templates, samples and libraries of vector stencils from drawing the ER-diagrams by Chen's and crow’s foot notations.
HelpDesk
How to Draw a Pyramid Diagram in ConceptDraw PRO

- What Is Marketing With Digram
- Relationship Marketing Digram
- Digram Of Service Marketing
- Marketing Diagrams | Digram Of Product Mix
- Service Marketing Diagram
- Block diagram - Marketing targeting | Process Flowchart | AWS ...
- Flowchart Marketing Process. Flowchart Examples | Marketing ...
- Venn Diagram Examples | Six Markets Model Chart | Venn Diagram ...
- Flowchart Marketing Process. Flowchart Examples | Process ...
- Ladder of customer loyalty diagram | Loyalty - Arrow circle diagram ...
- Marketing Diagrams | Gant Chart in Project Management | Pyramid ...
- Service-goods continuum diagram | Marketing diagrams - Vector ...
- Marketing | Competitor Analysis | Target Diagram | Product Mix ...
- Marketing mix - Wheel diagram | Competitor Analysis | Marketing | A ...
- Diagram Drawing Marketing
- Porter's Value Chain | Competitor Analysis | Block diagram - Porter's ...
- Marketing mix - Wheel diagram | Target diagrams - Vector stencils ...
- Venn diagram - Relationship marketing
- Graph Or Diagram Product Mix In Service Marketing
- Relationship Marketing