HelpDesk
How to Draw a Chemical Process Flow Diagram
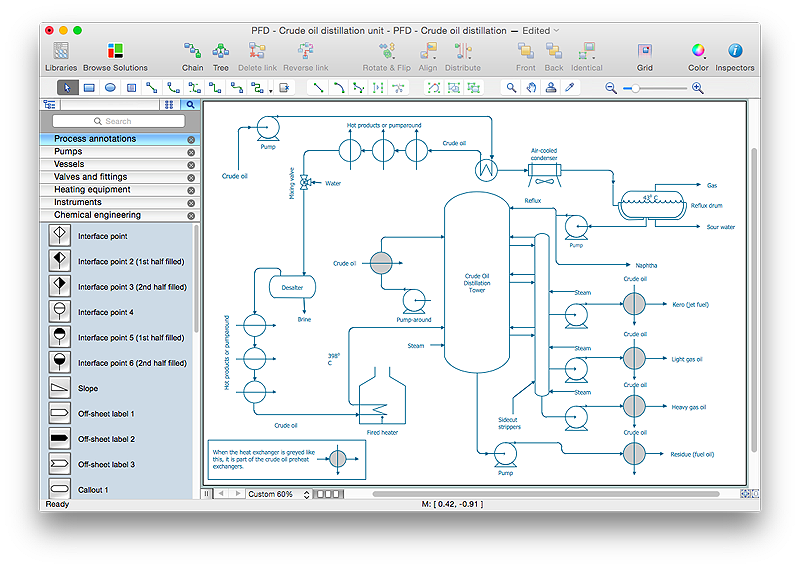
Process Flow Diagram widely used in modeling of processes in the chemical industry. A Chemical Process Flow diagram (PFD) is a specialized type of flowchart. With the help of Chemical Process Flow Diagram engineers can easily specify the general scheme of the processes and chemical plant equipment. Chemical Process Flow Diagram displays the real scheme of the chemical process, the relationship between the equipment and the technical characteristics of the process. Chemical Process Flow Diagram illustrates the connections between the basic equipment as well as the overall structure of pipelines and other supporting equipment. The purpose of the PFD is to build the image of the basic idea of the chemical process. ConceptDraw PRO together with its Chemical and Process Engineering solution delivers the possibility to design Chemical Process Flow diagrams. It is designed for chemical industry engineers and designers.HelpDesk
How to Create a Mechanical Diagram
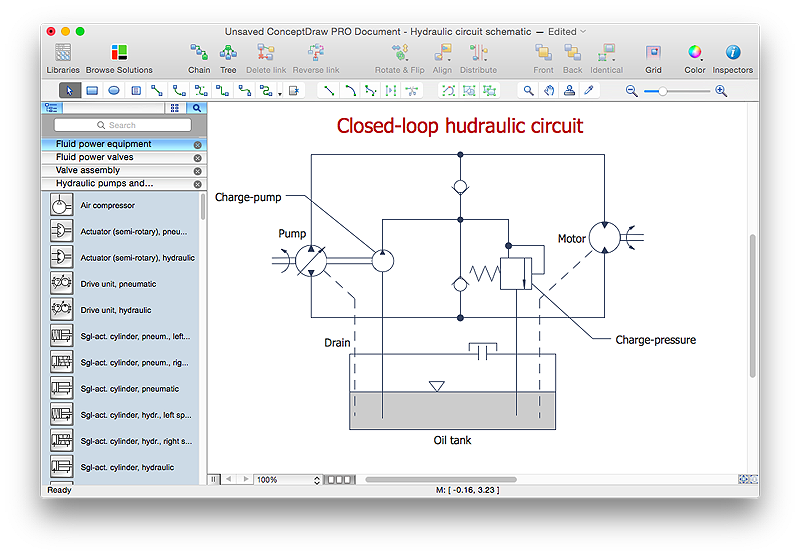
Mechanical Engineering drawing is a type of technical drawing that helps analyze complex engineering systems. Mechanical Engineering diagrams are often a set of detailed drawings used for engineering or construction projects.Making Mechanical Engineering diagram involves many different elements that can be managed using ConceptDraw PRO. You can design elements for drawing parts, assembly, pneumatic, and hydraulic systems for mechanical engineering. With ConceptDraw PRO you can easily create and communicate the Mechanical Engineering diagram of any complexity.
HelpDesk
How to Create an Electrical Diagram Using ConceptDraw PRO
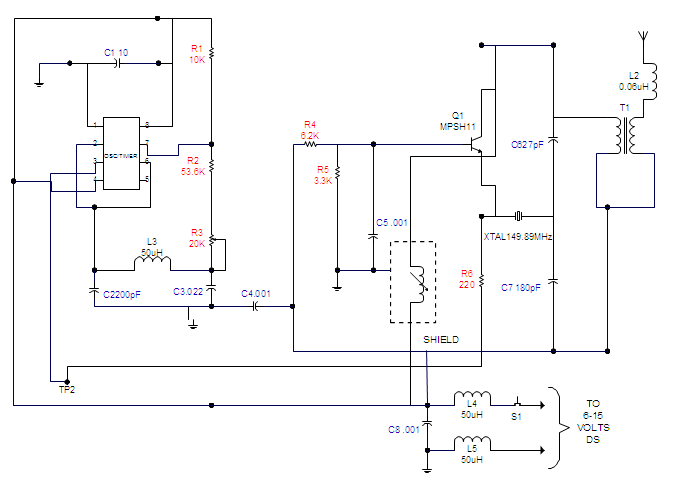
There are many of different electric circuit symbols that can be used in a circuit diagram. Knowing how to read circuit diagrams is a useful skill not only for professionals, but for any person who can start creating his own small home electronic projects. The circuit diagram shows the scheme of a location of components and connections of the electrical circuit using a set of standard symbols. It can be use for graphical documentation of an electrical circuit components.The ability to create electrical diagrams and schematic using ConceptDraw PRO is delivered by the Electrical Engineering solution. The solution supplied with samples, templates and libraries of design elements for drawing electrical schematics, digital and analog logic, circuit and wiring schematics and diagrams, power systems diagrams, maintenance and repair diagrams for electronics and electrical engineering.
HelpDesk
How to Draw a Pyramid Diagram in ConceptDraw PRO
Pyramid diagram (triangle diagram) is used to represent data, which have hierarchy and basics. Due to the triangular form of diagram, each pyramid section has a different width. The width of the segment shows the level of its hierarchy. Typically, the top of the pyramid is the data that are more important than the base data. Pyramid scheme can be used to show proportional and hierarchical relationships between some logically related items, such as departments within an organization, or successive elements of any process. This type of diagram is often used in marketing to display hierarchical related data, but it can be used in a variety of situations. ConceptDraw PRO allows you to make a pyramid diagram, quickly and easily using special libraries.HelpDesk
How to Create a Bank ATM Use Case Diagram Using ConceptDraw PRO
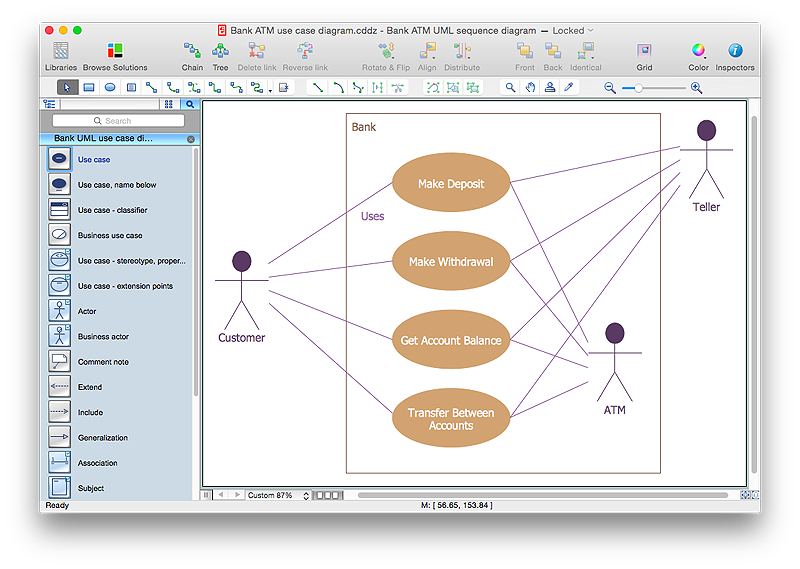
UML diagrams are often used in banking management for documenting a banking system. In particular, the interaction of bank customers with an automated teller machine (ATM) can be represented in a Use Case diagram. Before the software code for an ATM, or any other system design, is written, it is necessary to create a visual representation of any object-oriented processes. This is done most effectively by creating a Unified Modeling Language (UML) diagram, using object-oriented modeling. UML works as a general purpose modeling language for software engineers or system analysts, offering a number of different diagram styles with which to visually depict all aspects of a software system.ConceptDraw PRO diagramming software, enhanced and expanded with the ATM UML Diagrams solution, offers the full range of icons, templates and design elements needed to faithfully represent ATM and banking information system architecture using UML standards. The ATM UML Diagrams solution is useful for beginner and advanced users alike. More experienced users will appreciate a full range of vector stencil libraries and ConceptDraw PRO's powerful software, that allows you to create your ATM UML diagram in a matter of moments.
Comparing ConceptDraw PRO to Omnigraffle
Comparing ConceptDraw PRO to Omnigraffle you can see a lot of benefits of ConceptDraw products. First the main, ConceptDraw applications are cross-platform and available in two independent and concurrent versions for Macintosh (OS X) and PC (Windows). ConceptDraw gives you the per named license, that you can use simultaneously for your both Macintosh and PC, at work and at home. Free access to the ConceptDraw Solution Park offers you great number of solutions with hundreds of templates and samples, and thousands of ready-to-use vector objects for quick and easy creation diagrams, drawings, illustrations and Mind Maps. Besides, thanks to the Ingyre Technology is provided the integration with Microsoft Office applications and capabilities of limitless exchange the information. The ConceptDraw Live Objects technology lets you design the visual dynamically-updated dashboards, the Rapid Draw technology allows create the diagrams in minutes. The extensive presentation capabilities help you create lush and beautiful presentation slideshows from your ConceptDraw documents.HelpDesk
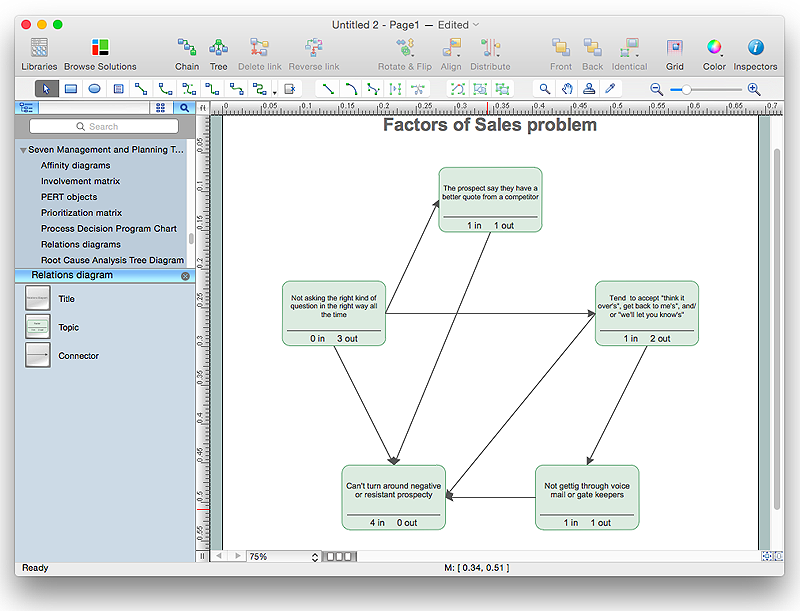
How To Create the Interaction (Relation) Diagram
Identify relationships between factors affecting a problem using interaction (relation) diagram. The ability to create a Relation diagram from a mind map is supported by the ConceptDraw Seven Management and Planning Tools solution.HelpDesk
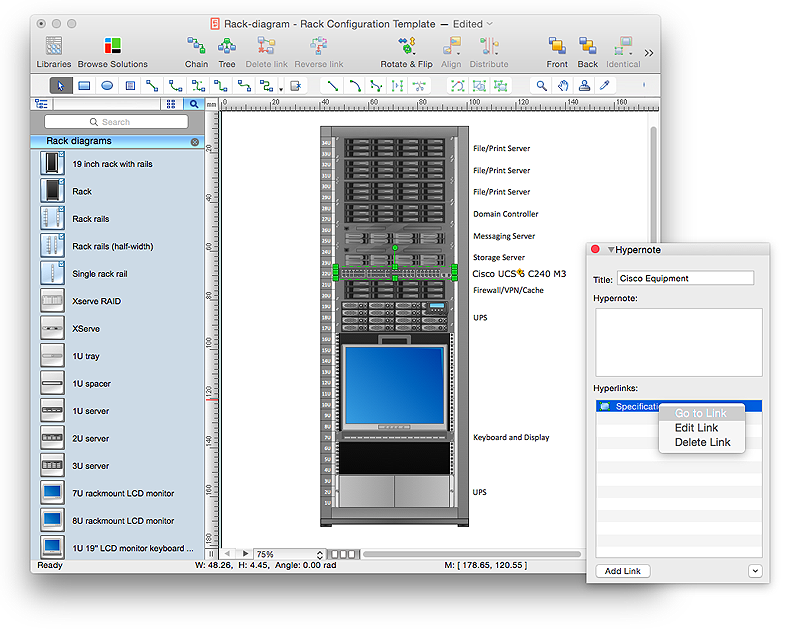
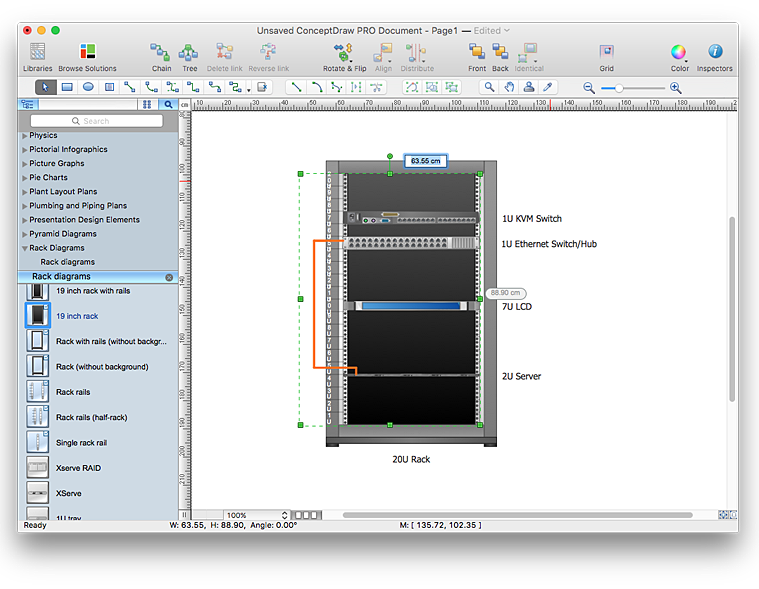
How to Create a Rack Diagram in ConceptDraw PRO
A Rack Diagram represents the rack mounting of network and computer equipment that is installed as a server. Rack diagrams are used by system administrators and network architectors when making a decision regarding the purchase of network equipment. It is used to show how a particular server configuration can be composed, without making its physical installation. ConceptDraw PRO enhanced with the Rack Diagrams Solution can be successfully used for making various rack diagrams. It's important that the solution used to create a rack diagram contains templates that stick to industry standards, and supplies a big selection of device icons to cover multiple types of equipment for a number of network configurations.HelpDesk
How to Resize Objects in ConceptDraw PRO
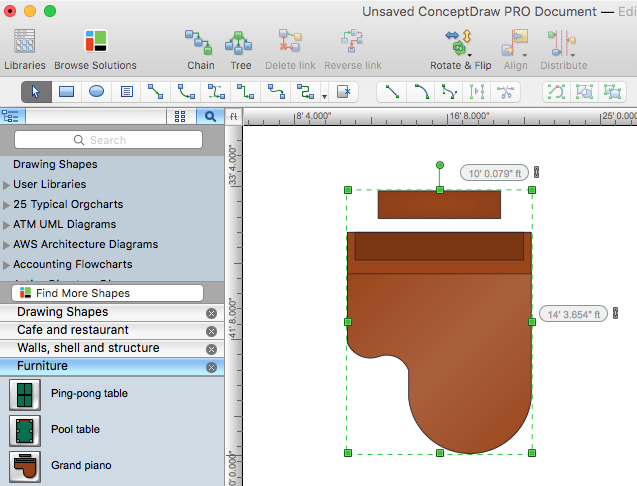
When creating diagram using ConceptDraw PRO, you can select, move, resize and rotate objects. After selecting an object (or objects) in a document, you can change it position, resize it or move an object to the desired position. The sizes of objects in ConceptDraw PRO can be changed by simple dragging, or you can set a particular size of any object. Using ConceptDraw PRO, you can re-size an object on the page using the absolute measurements instead of a mouse. You can make quick work of designing complex drawing using a combination of different-sized items.HelpDesk
How to Create a Telecommunication Network Diagram in ConceptDraw PRO
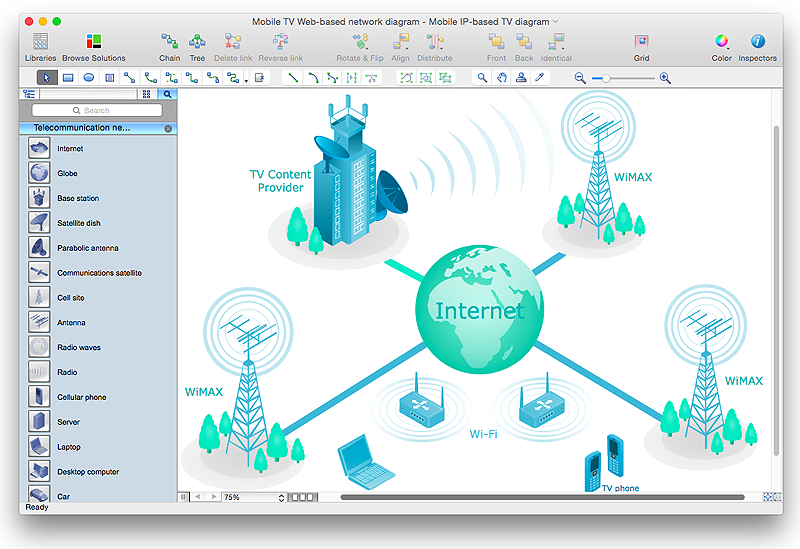
Telecommunication network diagram displays components and connections in a telecommunication network: how they are interacted between each other and with end-users. Telecommunication network diagrams usually created by system engineers for planning telecom networks. Also they may be useful for a network management. Telecom network diagram visualizes the level of security and user access to certain eqipment and data within a current network. Telecom network diagram can be used to identify weak points of an entire network or a part of it. ConceptDraw PRO allows you to draw a simple and clear Telecommunication Network diagrams.ConceptDraw PRO: Able to Leap Tall Buildings in a Single Bound
ConceptDraw PRO is the world’s premier cross-platform business-diagramming tool. Many, who are looking for an alternative to Visio, are pleasantly surprised with how well they can integrate ConceptDraw PRO into their existing processes. With tens of thousands of template objects, and an easy method for importing vital custom objects from existing Visio documents, ConceptDraw PRO is a powerful tool for making extremely detailed diagrams, quickly and easily.HelpDesk
How to Create a Bubble Diagram Using ConceptDraw PRO
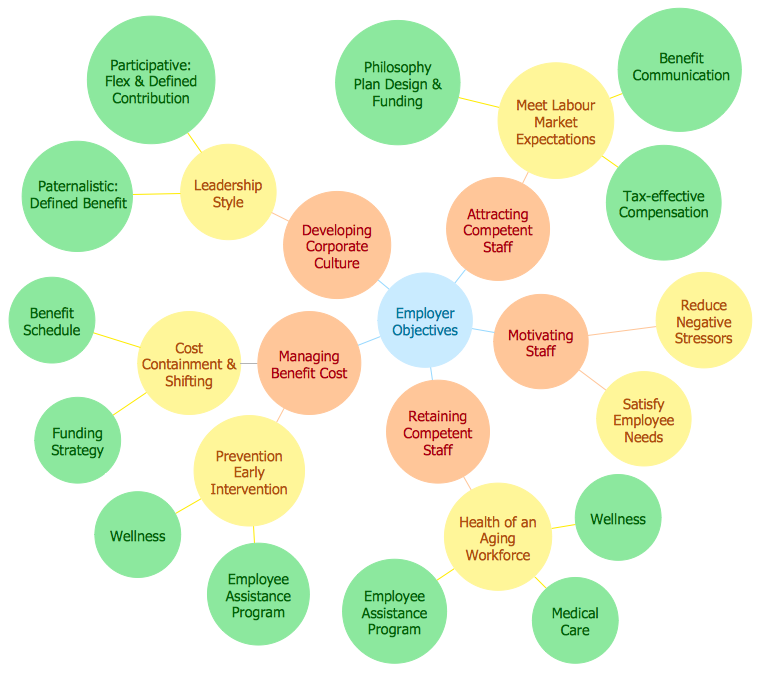
Bubble Diagram is a simple chart that consists of circles (bubbles) repesening certain topics or processes. Bubbles are connected by lines depicting the type of relationships between the bubbles. The size of each bubble is depended on the importance of the entity it represents. Bubble charts are widely used throughout social, economical, medical, and other scientific researches as well as throughout architecture and business management. Bubble charts are often used during the early stages of product development to visualize thoughts and ideas for the purpose of sketching out a development plan. ConceptDraw PRO allows you to draw a bubble diagrams using the Bubble Diagrams solution.HelpDesk
How to Change Measurement Units in ConceptDraw Drawing
There are different units of measurement that can be used for length dimensions. When making scaled drawing we can't keep in mind just meters, centimeters, and milimeters ; we also need remember about yards, feets and inches . This is because the United States applies its own system of measurement units, while the rest of the world employs metric measurement units. ConceptDraw PRO enables choosing the most suitable units of measurement with just one click.HelpDesk
How to Draw a Process Flow Diagram in ConceptDraw PRO
Process Flow diagrams are used in chemical and process engineering to show the flow of chemicals and the equipment involved in the process. When it comes to creating a process flow diagram, it's important to use software that is capable of describing a wide range of processes, using techniques and graphical notation that are easily recognized by engineering workers. An ideal drawing platform will utilize functions that can cope with the output of a high volume of engineering processes, that may change rapidly from development to implementation stages. ConceptDraw PRO, with the extended functionality of the Chemical and Process Engineering Diagrams solution, is the ideal medium for creating designs of this type. The Chemical and Process Engineering Diagrams solution complements this feature with a library of selected icons to represent various steps — all instantly recognizable and applicable to a wide user base. ConceptDraw PRO allows you to draw the Process Flow diagram easily using the set of special libraries.HelpDesk
How to Draw a Block Diagram in ConceptDraw PRO
Block diagram is a simple chart that use blocks to show some elements or activities, and connectors that show the relationship between neighboring blocks. They are commonly simple, giving an overview of a process without necessarily going into the specifics of implementation. Block diagrams are commonly used to depict a general description of a system and its activity. A most known sample of a block diagram is a flow chart, used in many types of business as a common method of representing repeated processes. Easy and a simple creation, a number of objects and connectors make the block diagram a many-sided tool for various industries. The ability to make block diagrams is delivered by the ConceptDraw Block Diagrams solution.- Engineering Kpi Dashboard
- Process Flow Diagram Of Kpi
- Entity Relationship Diagram Symbols and Meaning ERD Symbols ...
- Sales KPI Dashboards | What is a KPI ? | A KPI Dashboard ...
- Visualize Sales Data Using Sample Data | A KPI Dashboard ...
- Mechanical Engineering | Total Quality Management TQM Diagrams ...
- Rack Diagrams | Types of Flowchart - Overview | Chemical and ...
- SWOT Analysis | Marketing | Fishbone Diagram | Sample Swot Of An ...
- Engineering | Product Overview | Universal Diagramming Area ...
- Mechanical Drawing Symbols | Mechanical Engineering | Meter In ...
- Universal Diagramming Area | Engineering | Product Overview ...
- Entity-Relationship Diagram (ERD) with ConceptDraw PRO ...
- Constant improvement of key performance indicators | TQM Diagram ...
- Fishbone Diagram
- Entity Relationship Diagram Software Engineering
- Sales KPI Dashboards | KPIs and Metrics | Reporting Dashboard ...
- Basketball Court Dimensions | Basketball Court Diagram and ...
- Sales Dashboard - Access Anywhere | Business Intelligence ...
- Process Flowchart | Chemical and Process Engineering | Cross ...
- Universal Diagramming Area | Engineering | Software development ...
