 Aerospace and Transport
This solution extends ConceptDraw PRO software with templates, samples and library of vector clipart for drawing the Aerospace and Transport Illustrations. It contains clipart of aerospace objects and transportation vehicles, office buildings and anci
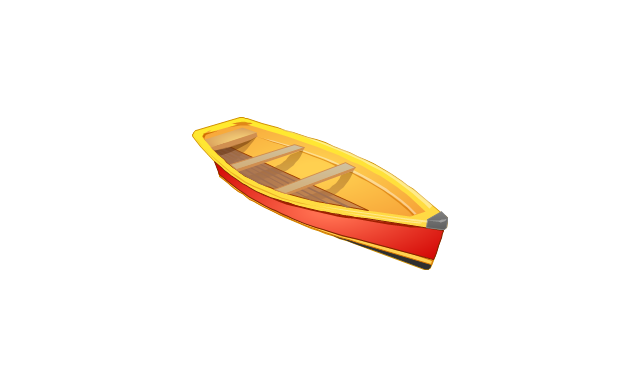
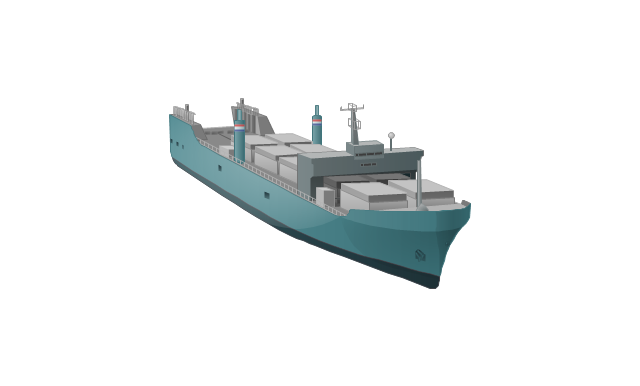
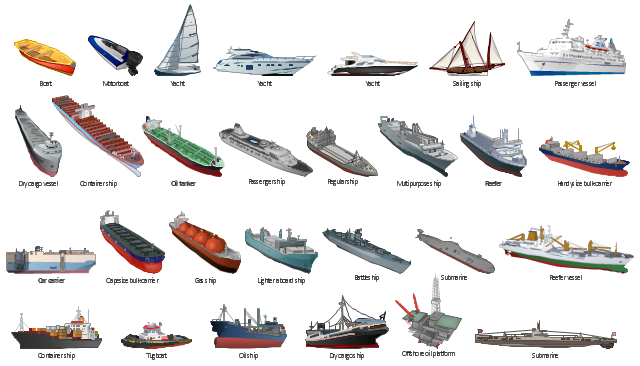
The vector stencils library "Watercraft" contains 28 clip art images for creating ship transport illustrations, presentation slides, infographics and webpages using the ConceptDraw PRO diagramming and vector drawing software.
"The term watercraft covers a range of different vehicles including ships, boats, hovercraft and submarines, and differs from a simple device that merely floats, such as a log raft. ...
Usually the purposes behind watercraft designs and skills are for seafaring education or leisure activities, fishing and resource extraction, transportation of cargo or passengers, and for conducting combat or salvage operations. In general, the purpose of a water vehicle identifies its utility with a maritime industry sub-sector." [Watercraft. Wikipedia]
The vector stencils library "Watercraft" is included in the Aerospace and Transport solution from the Illustrations area of ConceptDraw Solution Park.
www.conceptdraw.com/ solution-park/ illustrations-aerospace-transport
Boat
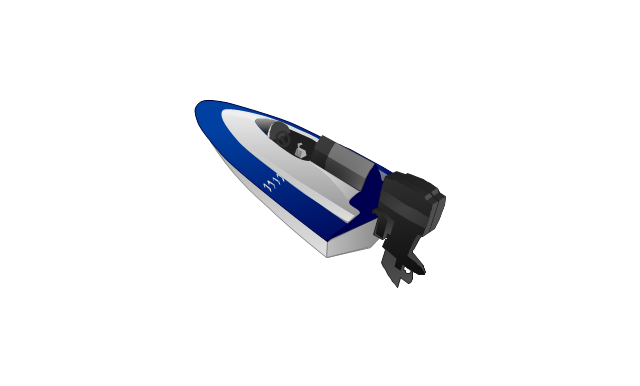
Motorboat
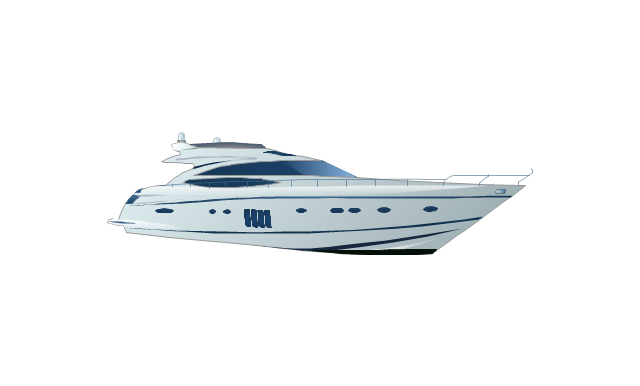
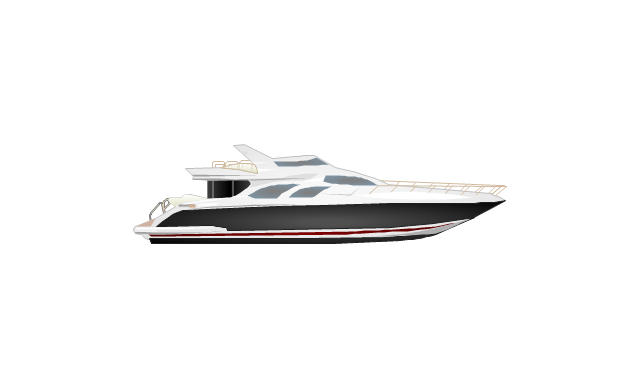
Yacht
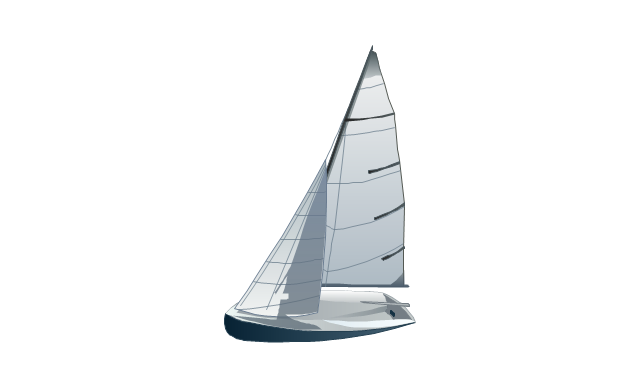
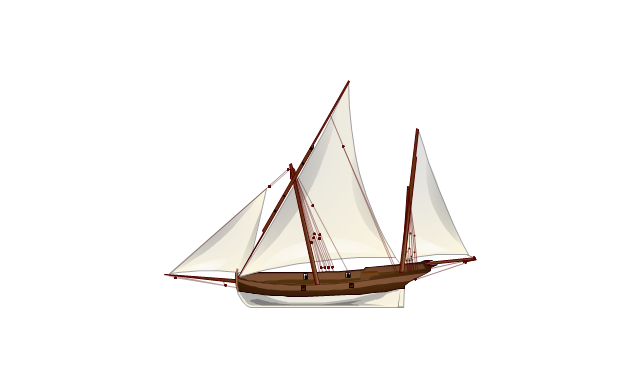
Sailing yacht
Motor yacht
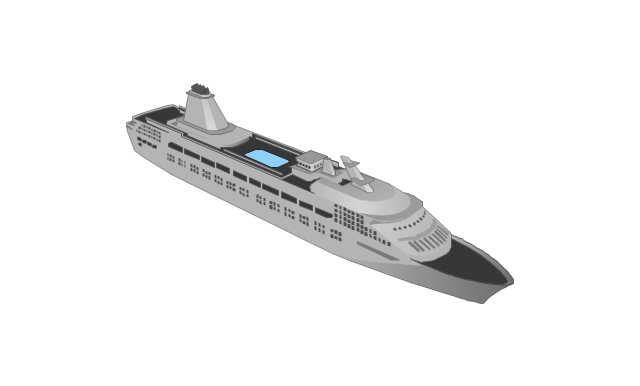
Passenger vessel

Sailing ship
Passenger ship
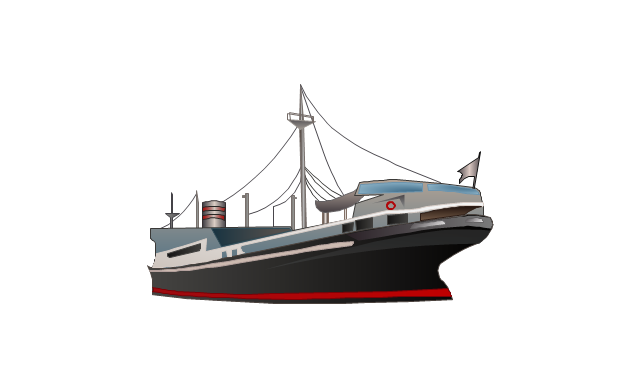
Regular ship
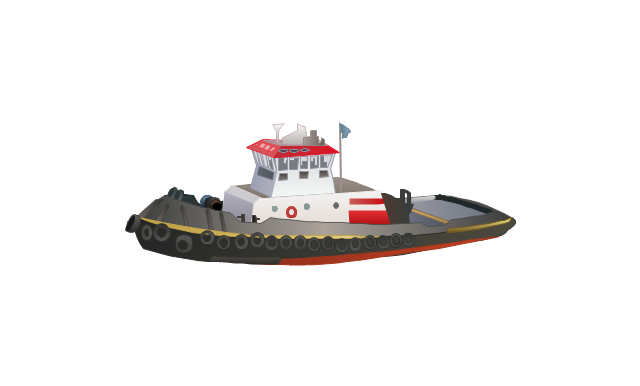
Tugboat
Oil ship
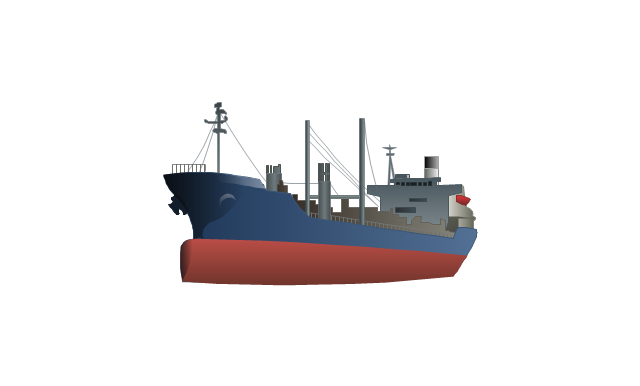
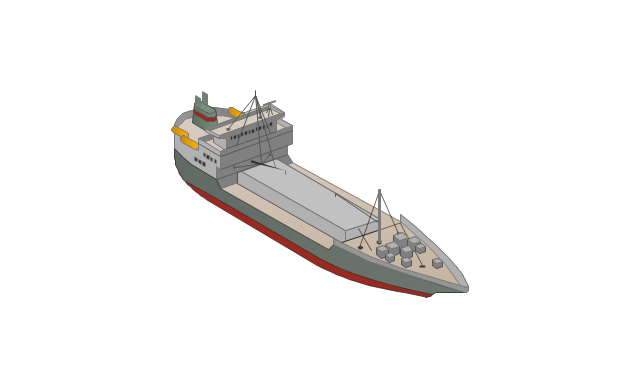
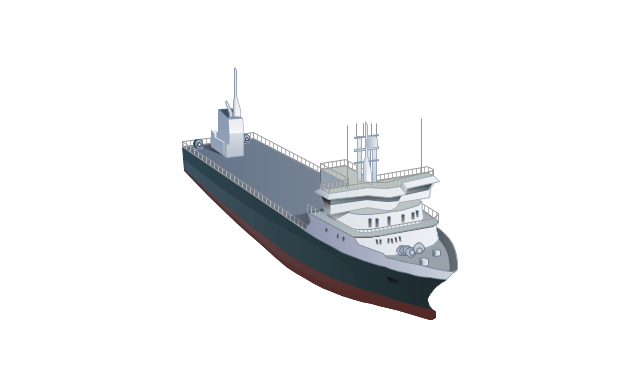
Dry cargo ship
Dry cargo vessel
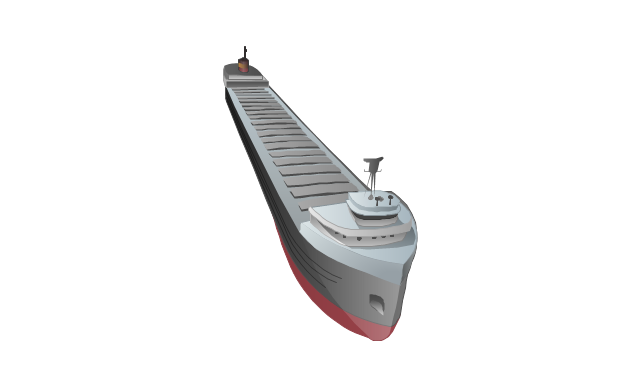
Capesize bulk-carrier
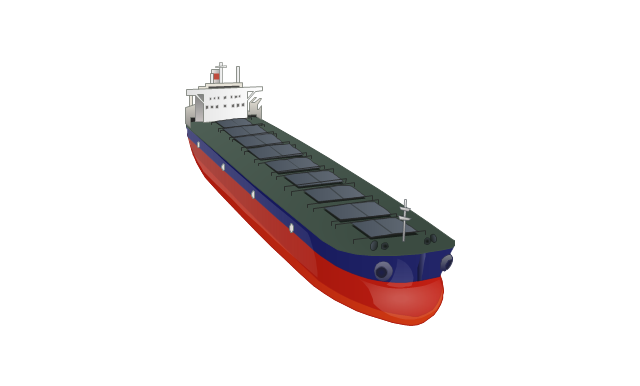
Handysize bulk-carrier
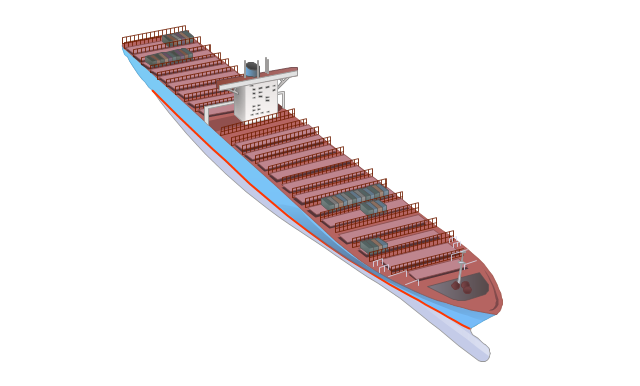
Container ship
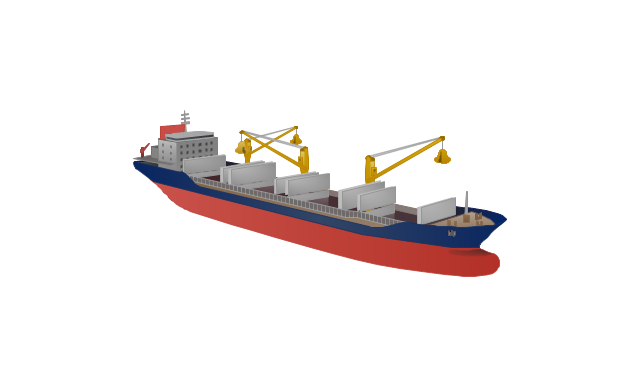
Multipurpose ship
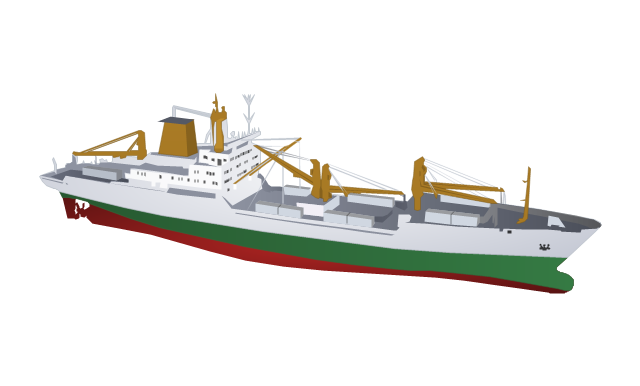
Reefer
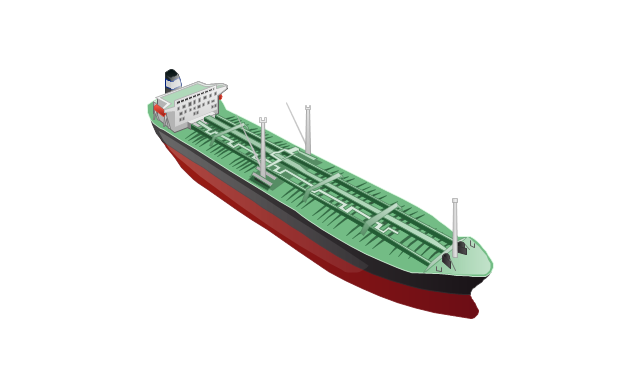
Oil tanker
Reefer vessel
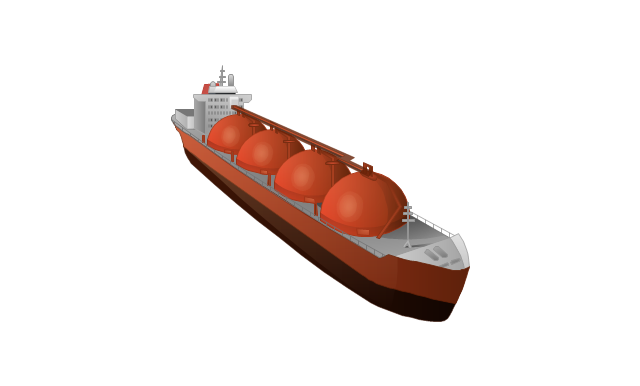
Gas ship
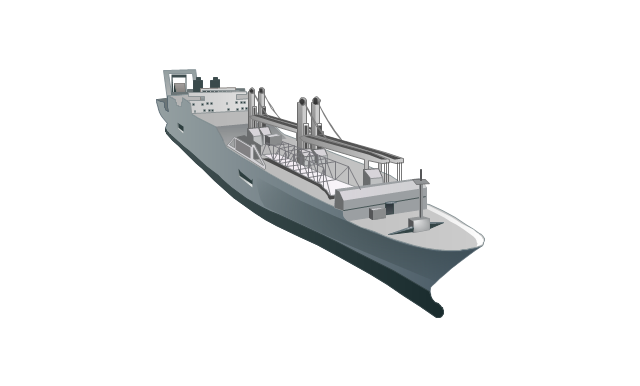
Lighter aboard ship
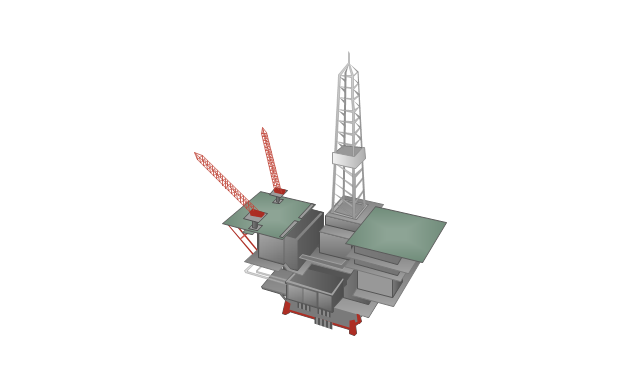
Offshore oil platform
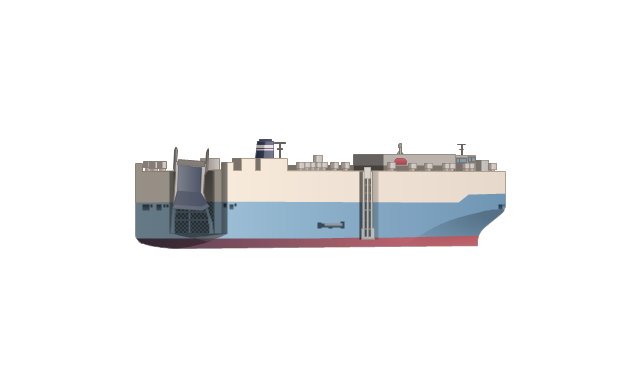
Car carrier
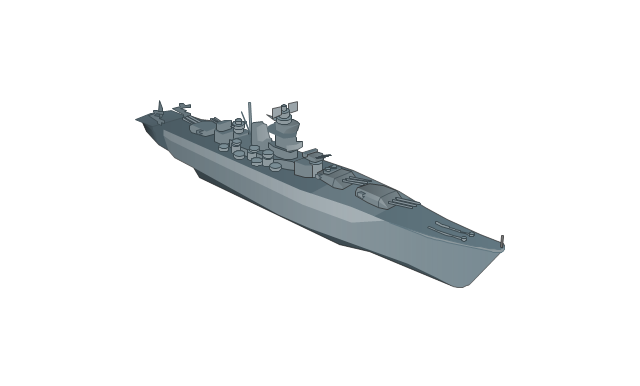
Battleship
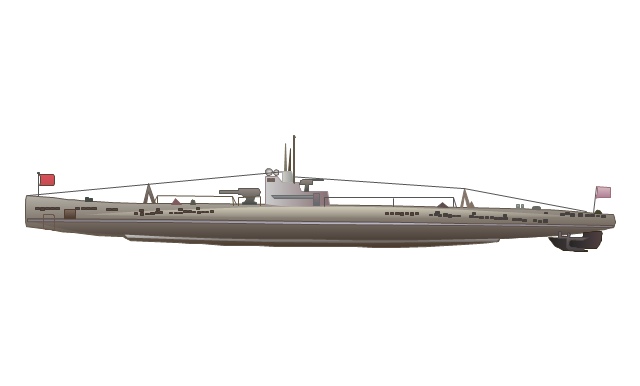
Submarine
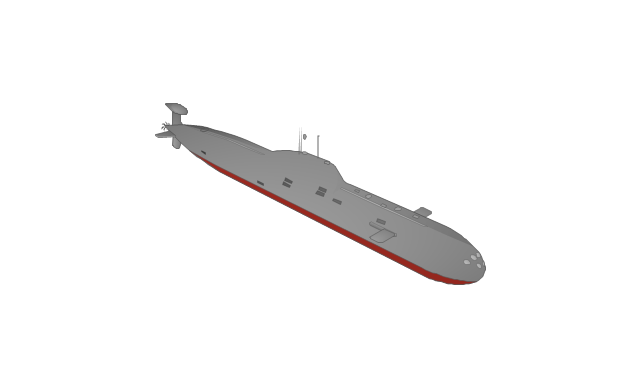
Submarine
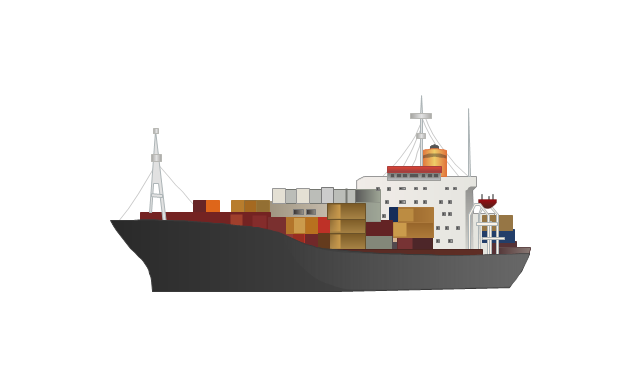
Container ship
The vector stencils library "Picture Graphs" contains 35 templates of picture bar graphs for visual data comparison and time series.
Drag a template from the library to your document, set bars number, type category labels, select bars and enter your data.
Use these shapes to draw your pictorial bar charts in the ConceptDraw PRO diagramming and vector drawing software.
The vector stencils library "Picture Graphs" is included in the Picture Graphs solution from the Graphs and Charts area of ConceptDraw Solution Park.
Arrow
Water drop

Food

Grain

Agriculture

Medicines

Houses

Buildings

Money bags

Oil barrels

Natural gas

Electrical power

Nuclear power

Mechanical engineering

Chemical industry

Mining

Gold bars

Coins

Person

Men, women and children

Man

Woman

Child

Milk

Meat

Fruits

Vegetables

Computer

Mobile phone

Airliner

Car

Bus

Truck

Train

Cargo ship

This work flow chart sample was redesigned from the picture "Weather Forecast" from the article "Simulation Workflows".
[iaas.uni-stuttgart.de/ forschung/ projects/ simtech/ sim-workflows.php]
"(1) The weather is predicted for a particular geological area. Hence, the workflow is fed with a model of the geophysical environment of ground, air and water for a requested area.
(2) Over a specified period of time (e.g. 6 hours) several different variables are measured and observed. Ground stations, ships, airplanes, weather balloons, satellites and buoys measure the air pressure, air/ water temperature, wind velocity, air humidity, vertical temperature profiles, cloud velocity, rain fall, and more.
(3) This data needs to be collected from the different sources and stored for later access.
(4) The collected data is analyzed and transformed into a common format (e.g. Fahrenheit to Celsius scale). The normalized values are used to create the current state of the atmosphere.
(5) Then, a numerical weather forecast is made based on mathematical-physical models (e.g. GFS - Global Forecast System, UKMO - United Kingdom MOdel, GME - global model of Deutscher Wetterdienst). The environmental area needs to be discretized beforehand using grid cells. The physical parameters measured in Step 2 are exposed in 3D space as timely function. This leads to a system of partial differential equations reflecting the physical relations that is solved numerically.
(6) The results of the numerical models are complemented with a statistical interpretation (e.g. with MOS - Model-Output-Statistics). That means the forecast result of the numerical models is compared to statistical weather data. Known forecast failures are corrected.
(7) The numerical post-processing is done with DMO (Direct Model Output): the numerical results are interpolated for specific geological locations.
(8) Additionally, a statistical post-processing step removes failures of measuring devices (e.g. using KALMAN filters).
(9) The statistical interpretation and the numerical results are then observed and interpreted by meteorologists based on their subjective experiences.
(10) Finally, the weather forecast is visualized and presented to interested people." [iaas.uni-stuttgart.de/ forschung/ projects/ simtech/ sim-workflows.php]
The example "Workflow diagram - Weather forecast" was drawn using the ConceptDraw PRO diagramming and vector drawing software extended with the Workflow Diagrams solution from the Business Processes area of ConceptDraw Solution Park.
Work flow chart
The vector clipart library Watercraft contains 28 images of vehicles: ships, yachts, boats, vessels.
Use the vector stencils library Watercraft to draw water transportation, ships and vessels illustrations, presentation slides, infographics and diagrams using the ConceptDraw PRO diagramming and vector drawing software.
"The term watercraft covers a range of different vehicles including ships, boats, hovercraft and submarines... Usually the purposes behind watercraft designs and skills are for seafaring education or leisure activities, fishing and resource extraction, transportation of cargo or passengers, and for conducting combat or salvage operations. In general, the purpose of a water vehicle identifies its utility with a maritime industry sub-sector." [Watercraft. Wikipedia]
The design elements library Watercraft is included in the Aerospace and Transport solution from the Illustration area of ConceptDraw Solution Park.
Vector clip art
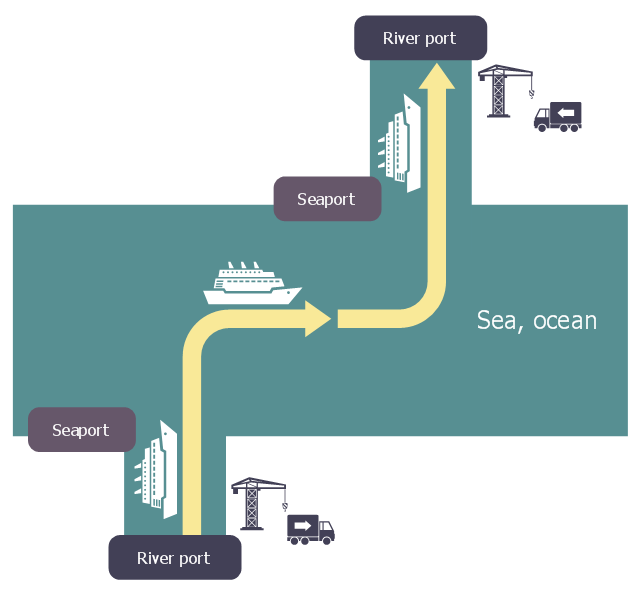
This logistic flow chart sample shows a chain of intermodal transport to link fluvio-maritime.
It was designed on the base of the Wikimedia Commons file: Logistique fluvio-maritime.jpg.
[commons.wikimedia.org/ wiki/ File:Logistique_ fluvio-maritime.jpg]
This file is licensed under the Creative Commons Attribution-Share Alike 3.0 Unported license. [creativecommons.org/ licenses/ by-sa/ 3.0/ deed.en]
"Intermodal freight transport involves the transportation of freight in an intermodal container or vehicle, using multiple modes of transportation (rail, ship, and truck), without any handling of the freight itself when changing modes. The method reduces cargo handling, and so improves security, reduces damage and loss, and allows freight to be transported faster. Reduced costs over road trucking is the key benefit for inter-continental use. This may be offset by reduced timings for road transport over shorter distances." [Intermodal freight transport. Wikipedia]
The logistic flowchart example "Intermodal transport chain" was created using ConceptDraw PRO diagramming and vector drawing software extended with the Logistics Flow Charts solution from the Business Processes area of ConceptDraw Solution Park.
Logistic flowchart
 Logistics Flow Charts
Logistics Flow Charts solution extends ConceptDraw PRO v11 functionality with opportunities of powerful logistics management software. It provides large collection of predesigned vector logistic symbols, pictograms, objects and clipart to help you design with pleasure Logistics flow chart, Logistics process flow diagram, Inventory flow chart, Warehouse flowchart, Warehouse management flow chart, Inventory control flowchart, or any other Logistics diagram. Use this solution for logistics planning, to reflect logistics activities and processes of an enterprise or firm, to depict the company's supply chains, to demonstrate the ways of enhancing the economic stability on the market, to realize logistics reforms and effective products' promotion.
- 3d Cargo Ship Icon
- Diagram Of A Cargo Ship
- Diagram Of Tanker Ship Image
- Diagram Of Multipurpose Ship
- Container Ship Diagram
- Basic Ship Diagram Cargo
- Manufacturing Diagram Of A Latest Model Of General Cargo Ship
- Diagram Of Cargo Ship And Its Enitity
- Cargo Ship Drawing
- Watercraft - Vector stencils library | Entity-Relationship Diagram ...
- Aerospace and Transport | Chemical Tanker Ship Diagram
- Entity Relationship Diagram Symbols | Watercraft - Vector stencils ...
- Aerospace and Transport | Plant Layout Plans | Entity-Relationship ...
- Vector Diagrams Dry Bulk Ships
- Watercraft - Vector stencils library | Active Directory Diagram ...
- Diagram Of Yacht
- Diagram Of A Passenger Ship
- Diagram Of A Passenger Vessel With Label
- Ships